A Practical Guide to Building Jira Custom Reports in 2026
Need clearer Jira insights? Learn to build jira custom reports in 2026 and turn issue data into useful decisions. Read now to get started.
Jira can show sprint progress, overdue work, and issue trends, yet a standard dashboard may not answer the question your team is asking. When stakeholders need a clear view of cycle time or recurring blockers, basic charts can leave you assembling numbers manually.
That gap creates frustration: teams debate what a metric means, managers wait for updates, and small delivery problems become harder to spot. A custom report can bring the relevant Jira issues and measures into one useful view.
But here's the truth: a reliable report starts with a specific decision, not a colorful chart. Here's why: clear definitions, suitable filters, and regular checks make the results easier to trust. This guide walks you through planning, building, validating, and sharing Jira custom reports, with practical examples you can adapt in 2026.
How to Build a Jira Custom Report
Start with the question the report must answer. Then define the metric, identify the relevant issues, and choose a presentation that helps someone take action.
- Write the decision question. Make it concrete, such as, “Which active bugs have been unresolved for more than seven days?” or “How many stories did each team complete this sprint?” A focused question prevents a dashboard from becoming a collection of unrelated charts.
- Choose a metric and define it. Specify what counts and how you will measure it. For cycle time, decide whether the clock starts when work enters “In Progress” and stops at “Done.” Teams may use the same metric name while applying different rules.
- Find the fields and statuses you need. Check that the relevant projects use consistent issue types, status names, and custom fields. If one team uses “Ready for QA” and another uses “Testing,” agree on how those statuses fit the report before building it.
- Create and test a JQL filter. Use Jira Query Language to define the issues in scope. For example, a filter for unresolved bugs in a project might use
project = SHOP AND issuetype = Bug AND resolution = Unresolved. Adjust field names and conditions to match your Jira setup.
- Select a report format. Use a table when people need to inspect individual issues. Choose a chart for comparisons or trends, such as open bugs by priority. A dashboard can combine a small set of related views.
- Validate the results with real issues. Open several matching issues and confirm that the filter includes the right records. Compare a sprint total with the team’s board, and check boundary cases such as work reopened after completion.
- Share the view and set a review rhythm. Give the intended audience access to the filter and dashboard. Add an owner who can check definitions and permissions when projects, workflows, or reporting needs change.
The result should help someone make a decision without needing a separate explanation. For example, a chart showing ten overdue bugs becomes more useful when it also identifies their owners and links to the issues.
Choose the Right Jira Reporting Method
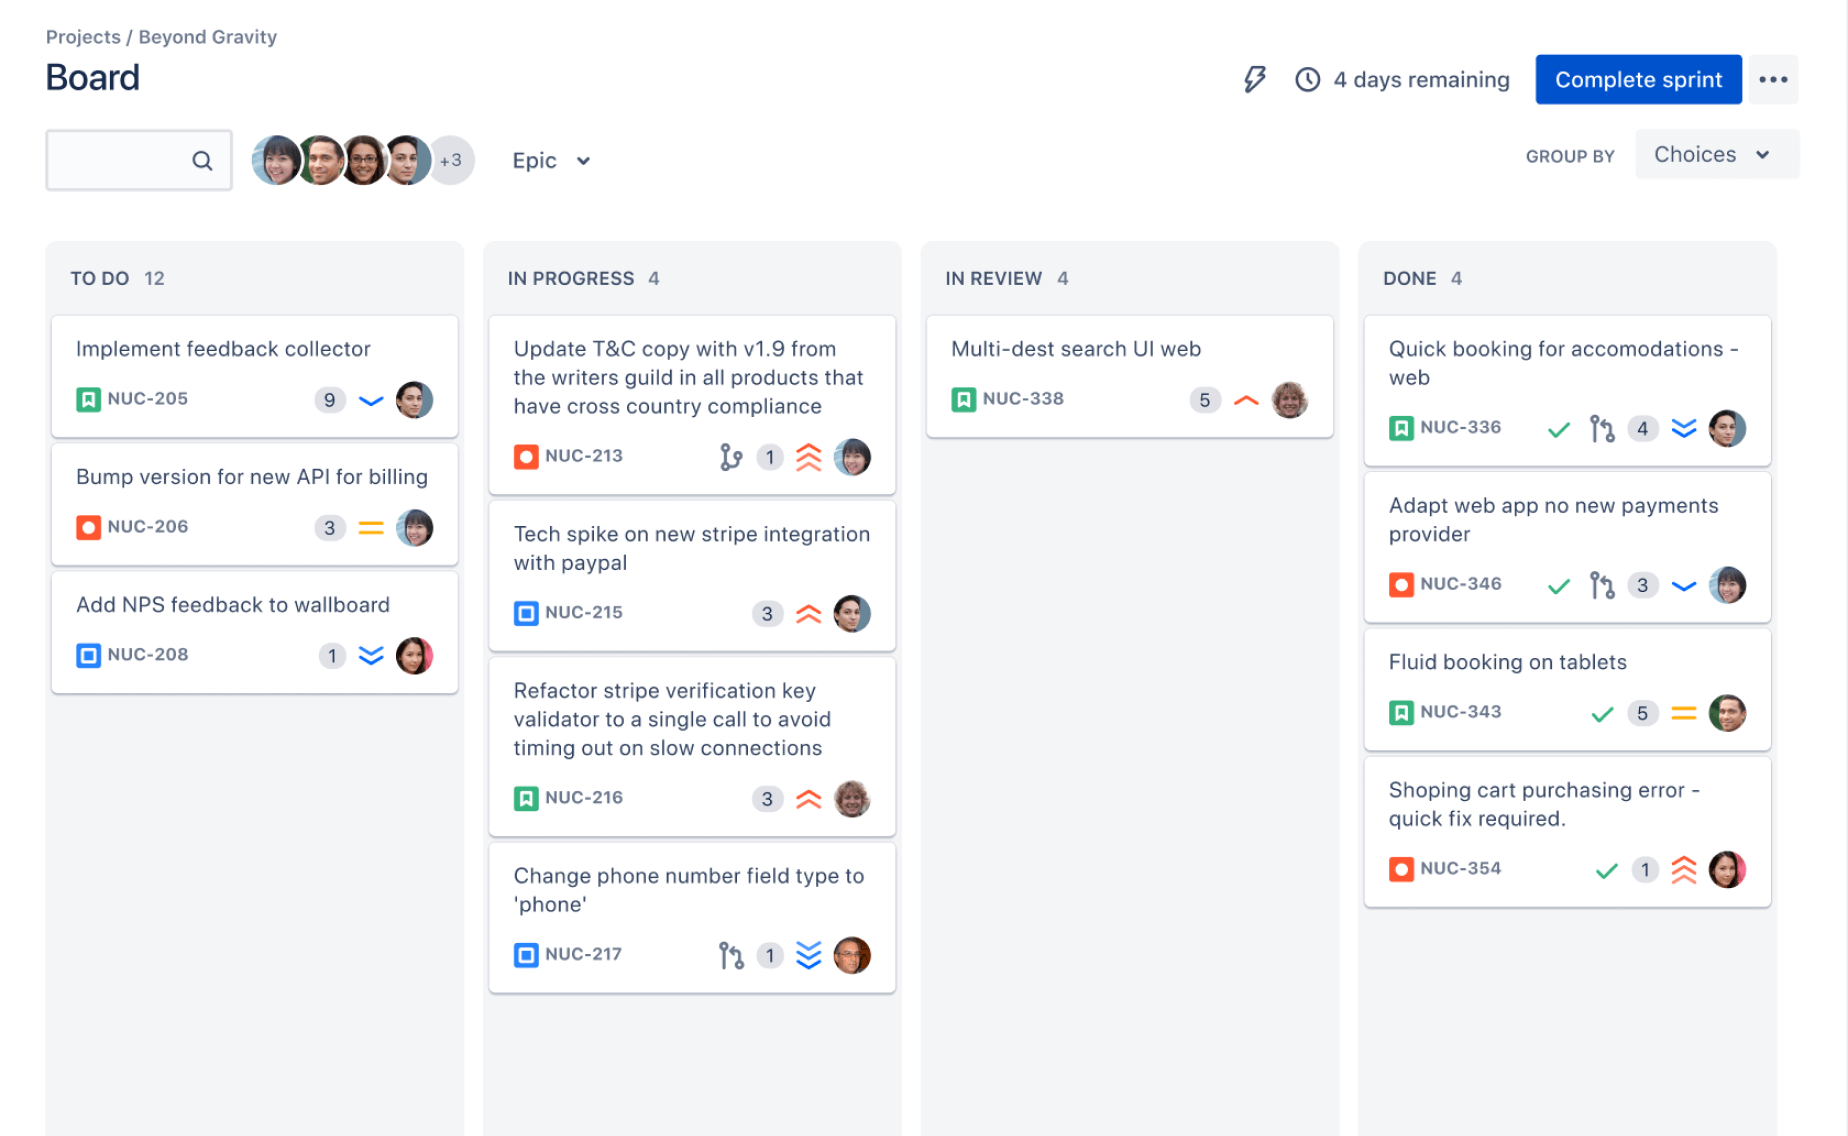
Jira offers several ways to present project information. The right choice depends on whether you need to inspect issues, compare groups, track change over time, or combine several views.
Use filters for precise issue lists
A saved JQL filter works well when people need to review individual issues. A support lead might filter for high-priority incidents that remain open, then sort by age or assignee.
Filters also provide a reusable definition of the report’s scope. Keep the conditions readable, and use a descriptive name that tells colleagues what the filter includes.
Use charts and dashboards for patterns
A chart can make a comparison easier to scan. For example, a bar chart showing unresolved bugs by priority may reveal that most of a team’s open work sits in one category.
Dashboards can bring related views together, such as sprint progress, open blockers, and recently resolved issues. Keep the layout focused: a dashboard crowded with small charts can make the main signal harder to find.
Consider a tailored reporting workflow
Built-in options may cover routine needs. If stakeholders require a specialized calculation, recurring cross-project analysis, or a presentation beyond standard gadgets, consider whether your Jira setup supports an appropriate app or integration.
Check the permissions, maintenance effort, and compatibility requirements before adopting an extension. A custom report that depends on a fragile workaround can create extra work whenever the workflow changes.
Plan Metrics That People Can Trust
Metric definitions shape the story a report tells. If two teams define “completed work” differently, a combined chart can suggest a performance gap that comes from process differences.
Write down the start point, end point, time period, and exclusions for each measure. For example, a cycle-time report might start when an issue enters “In Progress,” stop when it reaches “Done,” and exclude cancelled work.
Use a practical example
Imagine a product team wants to reduce slow bug resolution. It creates a filter for unresolved bugs, adds age and priority to a table, and groups a chart by assignee. The table supports follow-up on specific issues, while the chart helps spot where work is accumulating.
Before comparing teams, check whether they use the same priority scale and status flow. If they do not, make the differences visible or compare each team against its own earlier results.
Validate, Maintain, and Share Reports
A report needs occasional attention because projects evolve. New statuses, renamed fields, permission changes, and updated team practices can all affect what a filter returns.
Set a review date that fits the report’s purpose. A weekly sprint dashboard may need a quick check each planning cycle, while a quarterly leadership view can receive a review before each reporting period.
Check permissions and interpretation
Confirm that the intended viewers can access the filter and its underlying issues. A chart can appear incomplete when viewers have different project permissions, so test the view with an account that reflects the audience.
Add a short description explaining the metric and its limits. For instance, note whether the report excludes subtasks or counts reopened issues. This helps people interpret the chart without guessing.
Examples of Useful Custom Reports
Concrete examples make it easier to match a reporting method to a real need. A delivery manager, a service team, and a product owner may all use Jira, but they need different views.
Sprint delivery and scope change
A sprint report can show completed issues alongside work added after the sprint began. That comparison helps a team discuss scope changes during a retrospective instead of relying on memory.
Pair the chart with a short issue list for added work. The chart shows the overall pattern; the list gives the team specific examples to review.
Bug aging and ownership
A bug-aging view can group unresolved issues into age ranges, such as under three days, three to seven days, and more than a week. Include priority and assignee so the team can identify the next action.
For example, a growing group of high-priority bugs older than seven days may point to a need for triage or additional investigation. The report makes the buildup visible, while the team decides how to respond.
Cross-project release readiness
A release view can bring together issues tagged for a target version across several projects. A table with status, owner, and priority can help release leads identify unfinished work before a review meeting.
Check that teams apply the release field consistently. Otherwise, the view may leave out relevant issues or include work that belongs to a different release.
Jira Custom Reporting Solution: ONES.com
Value proposition: ONES.com combines project management and knowledge management in one platform, with ONES Project for project management and ONES Wiki for knowledge management. They are sold separately, so teams can choose the product that fits their needs.
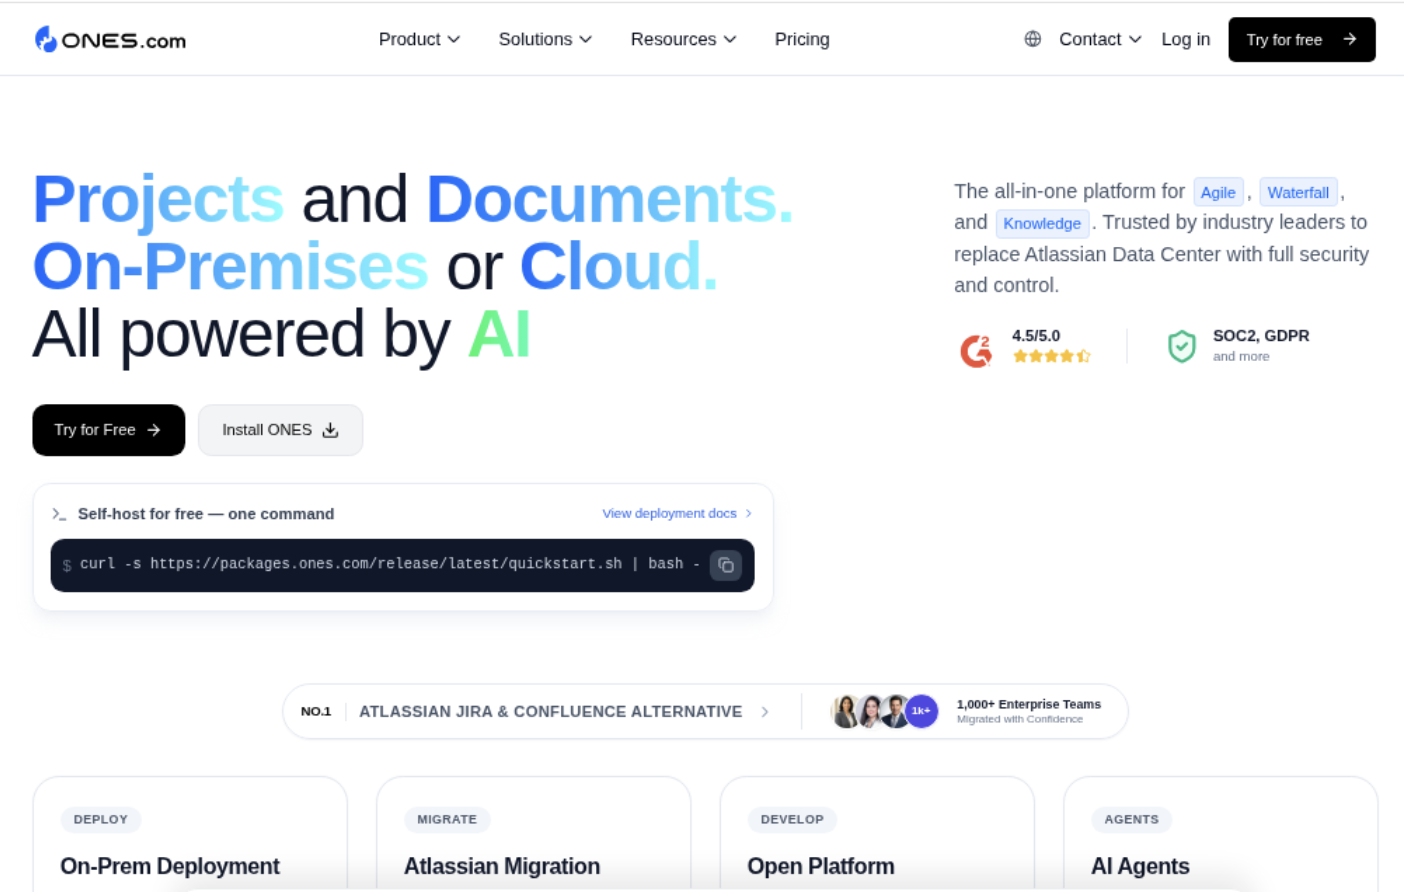
For teams reviewing a Jira alternative, ONES Project offers Jira-compatible workflows, custom fields, sprint management, automation, and built-in reporting. Native capabilities can reduce reliance on extra plugins, while deployment choices include cloud and self-hosted environments.
Core capabilities
- Reporting feels disconnected from daily project work: ONES Project includes built-in reporting. Teams can review project progress within their project management workflow.
- A workflow needs fields beyond standard issue details: Custom fields let teams capture the information their process requires. Reports can use that information to support more relevant views.
- Teams need to adapt issue movement to their process: Custom workflows support different stages and handoffs. That can make status-based reporting better reflect how work actually moves.
- Sprint planning needs clearer progress visibility: Sprint management helps teams organize and review sprint work. Reporting can provide a view of progress for planning and retrospectives.
- Repeated actions take time: Automation can handle selected routine workflow actions. This can reduce manual steps around issue updates and handoffs.
- Plugin dependence adds operational overhead: Built-in capabilities may reduce the number of extra plugins a team needs for common project workflows and reporting.
- Hosting requirements limit platform choices: ONES.com offers Cloud, On-Premise, Private Cloud, and Air-gapped deployments. Teams can evaluate the deployment that matches their environment.
- Self-hosted teams worry about feature gaps: ONES.com provides full feature parity between cloud and self-hosted versions, allowing teams to assess deployment needs without choosing a reduced feature set.
Application scenarios
A software team could use ONES Project to manage sprints, tailor fields for release readiness, and review built-in reports alongside its workflow. Teams moving from Jira can assess Jira-compatible workflows as part of that transition.
An organization with restricted-network requirements could evaluate an Air-gapped or other self-hosted deployment. ONES.com offers a free plan for up to 30 seats, giving a team room to explore the platform before considering broader adoption.
Common Challenges and Practical Fixes
- Reports return too many issues: Review the project, status, date, and issue-type conditions in the JQL filter. Add only the constraints that match the report’s stated purpose.
- Different teams disagree about a metric: Define the start and end points, exclusions, and reporting period together. Add a concise explanation beside the report so the definition stays visible.
- A chart changes unexpectedly: Check for workflow edits, renamed fields, and changes to filter conditions. Compare several individual issues with the chart to find where the change began.
- Stakeholders cannot see the same results: Review filter sharing and project permissions. Test access with an account that has the same permissions as the intended audience.
- People see a problem but do not know what to do: Add an owner, a next-action field, or links to the issues that need attention. A useful report should make follow-up clear.
Frequently Asked Questions
What is a Jira custom report?
A Jira custom report is a tailored view of issues, fields, or project measures built to answer a specific question. It may use a saved JQL filter, a chart, a dashboard, or a combination of views. For example, a team could create a filter for overdue high-priority bugs and display the results in a table grouped by assignee.
Can I create custom Jira reports without an app?
Many reporting needs can be handled with Jira’s built-in filters, charts, and dashboards. Whether those options cover a specific requirement depends on the calculation, presentation, permissions, and Jira setup. Start with a focused question and test a saved filter. If the built-in options do not produce the view you need, review compatible extensions or integrations.
How do I make a Jira report more accurate?
Define the metric before building the chart. Confirm the statuses, fields, date range, and exclusions that affect the result, then test the report against several individual issues. If different teams use different workflows, explain those differences before comparing their results. Review the report after workflow or field changes.
What should a Jira project dashboard include?
Include views that support a shared decision, such as sprint progress, unresolved blockers, and recently completed work. A small dashboard is often easier to interpret than one with many unrelated gadgets. Give each chart a clear title, check viewer permissions, and explain any metric definitions that could be misunderstood.
Conclusion
Useful Jira custom reports begin with a clear question, a shared metric definition, and a filter that reflects the work you want to inspect. Choose a table for issue-level follow-up, a chart for patterns, and a dashboard when people need several related views together.
Then validate the results, check permissions, and revisit the report when workflows change. That approach turns reporting from a frustrating manual task into a practical way to spot blockers, guide discussion, and decide what your team should do next.