A Practical Guide to Building Jira Reports with eazyBI
Need clearer Jira insights? Build practical eazybi jira reports to uncover blockers and track sprint performance. Read now and get started.
Jira can track a busy project well, yet its standard reports may leave you guessing why work is slipping. A backlog count rarely explains whether issues are aging, which teams face blockers, or how sprint commitments compare with completed work.
That gap becomes frustrating when you need a clear answer for a planning meeting and end up rebuilding the same charts by hand. A report can also mislead when its filters, date ranges, or issue fields do not match the question you meant to ask.
eazyBI adds flexible analysis to Jira through custom reports, charts, and dashboards. You can start with a focused question, choose the right measures and dimensions, then share a useful view with your team.
But here's the truth: good reporting starts with a precise question, not a complicated chart. This guide walks you through building eazyBI Jira reports, checking their meaning, and keeping them useful as your projects change.
How to Build a Jira Report in eazyBI
Use this workflow to turn a project question into a report your team can interpret and act on.
- Choose one decision to support. Write down the question before opening the report builder. For example: “Are unresolved bugs older this month than last month?” is more actionable than “Show me project metrics.”
- Import the Jira information you need. Open eazyBI from Jira and select the relevant projects and issue fields for import. Check whether the needed custom fields and issue history are available in the import settings. Run an import before building your report.
- Select a measure and dimensions. Measures are the values you analyze, such as issues created, issues resolved, or story points. Dimensions let you group or filter those values, such as by project, assignee, issue type, sprint, or time.
- Arrange the report and test its meaning. Put a useful grouping on rows, a time period or comparison on columns, and narrow the result with page filters. Check a few visible issues in Jira to confirm the report’s totals and filters match your question.
- Choose a visualization and share the result. Use a table when people need exact values, or a chart when they need to spot a trend quickly. Save the report, add it to a dashboard if appropriate, and explain its filters and update timing.
For example, a team tracking bug resolution could place issue type on rows, months on columns, and issues resolved as the measure. A project filter can keep the view focused on the team’s work.
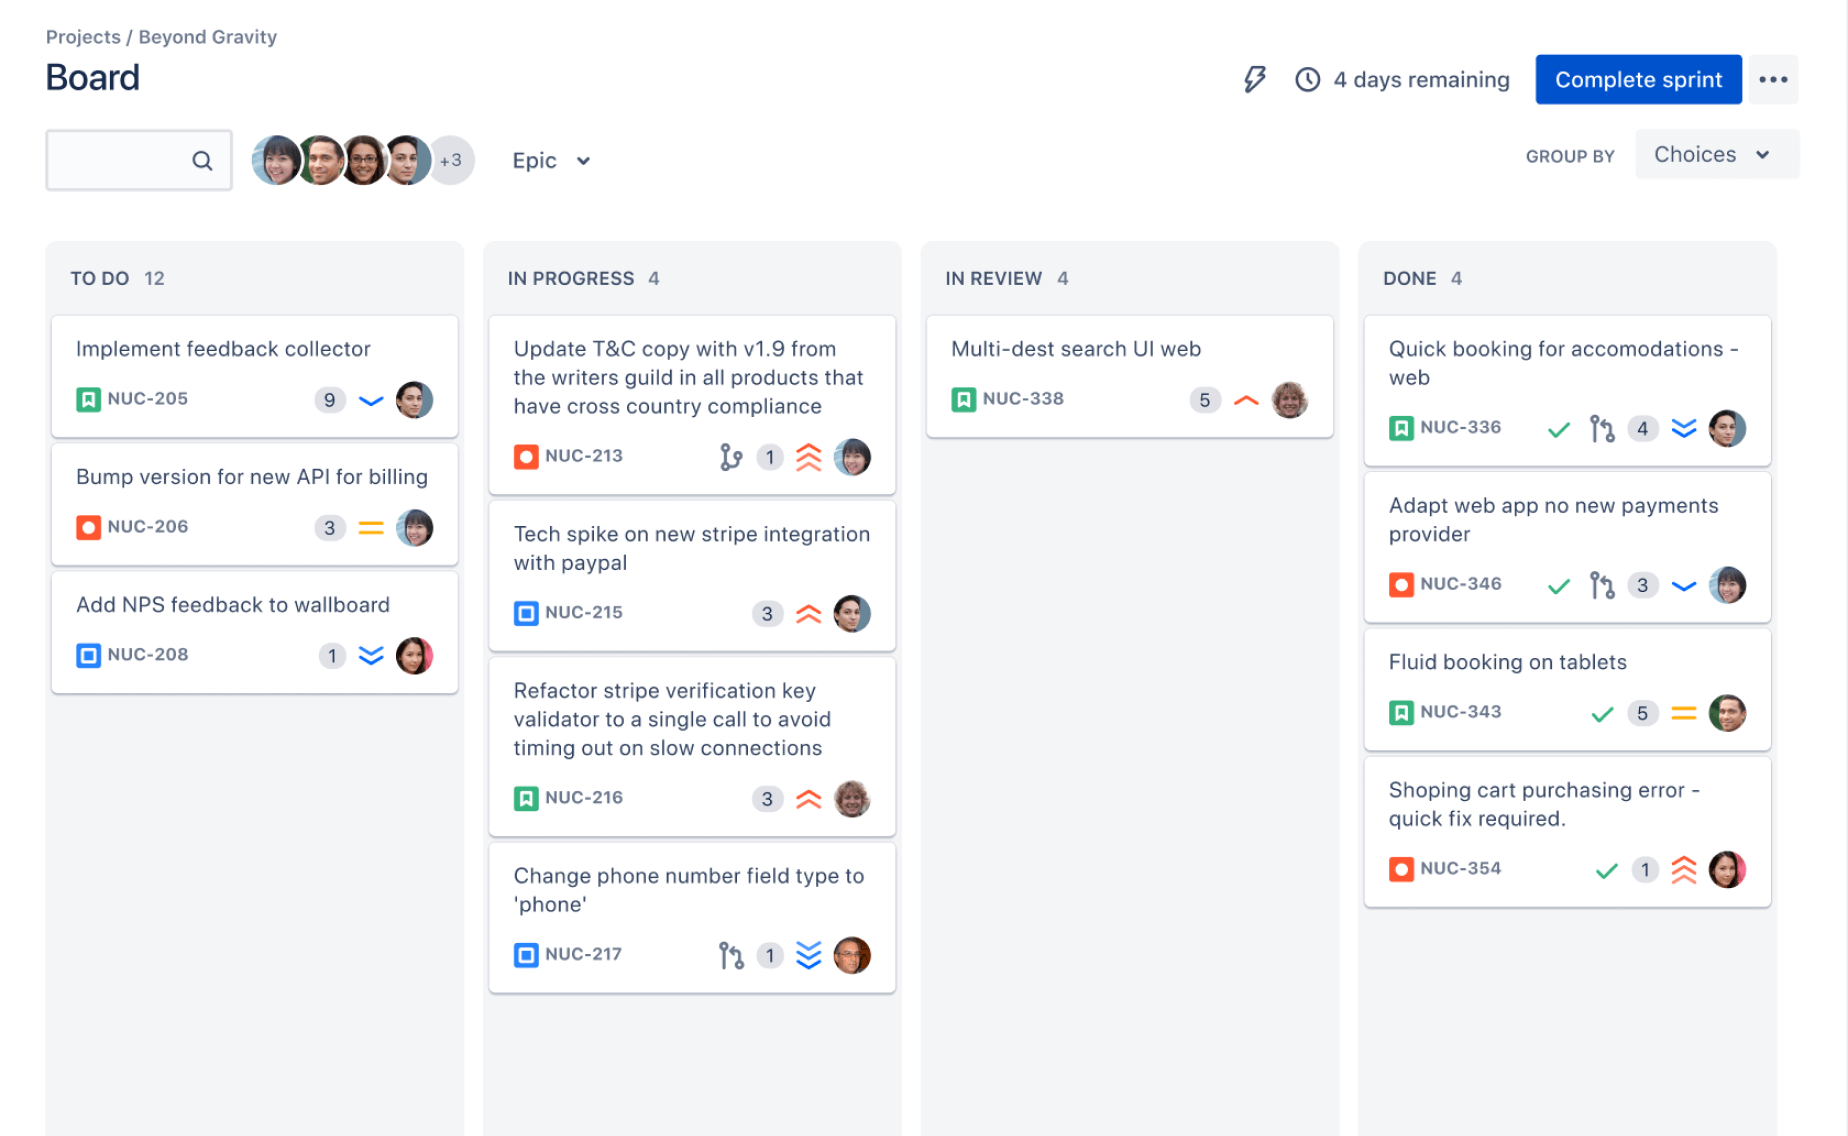
Turn a Broad Question Into a Useful Report
A report becomes easier to build when you define its audience, time period, and desired decision first. A product lead might need a monthly trend, while a sprint team may need a daily view of unresolved work.
Try writing a question with three parts: what you want to measure, how you want to group it, and which period matters. For example: “How many story points did each team complete per sprint this quarter?” This points you toward a measure, a team dimension, and a sprint or time dimension.
Here's why: a chart can look polished while answering the wrong question. If you count issues when stakeholders care about effort, the report may create an argument instead of a useful conversation.
Understand Measures, Dimensions, and Filters
Measures are numerical values, such as issue counts or story points. Dimensions give those values context. A report showing issues resolved by month uses a measure and a time dimension; adding assignee lets you compare workload across people.
Filters narrow the report without changing its basic question. For example, you can filter a project-level report to show only high-priority bugs, then compare the monthly totals. Confirm that each filter reflects the way your team defines the work.
You might be wondering: why do some totals change when you rearrange a report? A measure is evaluated within the current dimension context. A monthly issue count and a count grouped by sprint can differ when issues belong to multiple sprints or span multiple periods.
Use one known example to check the result. If a report shows 18 resolved issues in April, inspect a few matching Jira issues and verify their resolution dates and project filters.
Use Calculated Measures for Questions Standard Metrics Miss
Built-in measures cover common counts and estimates, but teams often need a metric that reflects their process. A calculated measure can help express a ratio or custom rule, such as resolved issues divided by created issues for a selected period.
Before creating one, define the numerator, denominator, and time context in plain language. If you want a resolution ratio, decide whether the calculation should compare issues resolved during a month with issues created during that same month. Those groups may include different issues.
Let me explain: a ratio is only meaningful when people understand what it compares. Label a custom measure clearly and describe its calculation in the report or dashboard notes. Test it with a small period before relying on it in a planning review.
eazyBI supports calculated measures using MDX. If your calculation depends on issue history, custom fields, or specific time behavior, test it against examples that your team can verify in Jira.
Build Dashboards People Can Read and Trust
A dashboard should help someone notice a change and decide what to do next. A sprint dashboard might show completed story points, unresolved high-priority issues, and work carried into the next sprint. Each view should answer a distinct question.
The best part? A clear table can be more useful than a complex chart. Use a chart for movement over time or differences between groups; use a table when exact values or issue-level follow-up matter.
Before sharing, review the date range, project scope, and access permissions. Also check how often the imported Jira information refreshes. A dashboard updated yesterday can be useful for a monthly review but confusing during a live stand-up.
Explain unusual metrics with a short note. For instance, if story points represent estimates rather than completed effort, say so. That small detail can prevent a team from treating a planning measure as a productivity score.
eazyBI Jira Reporting Solution: ONES.com
ONES.com combines project management and knowledge management in one platform, with ONES Project serving as a Jira alternative. Its built-in reporting can help teams review project progress without assembling every view through a separate analytics add-on.
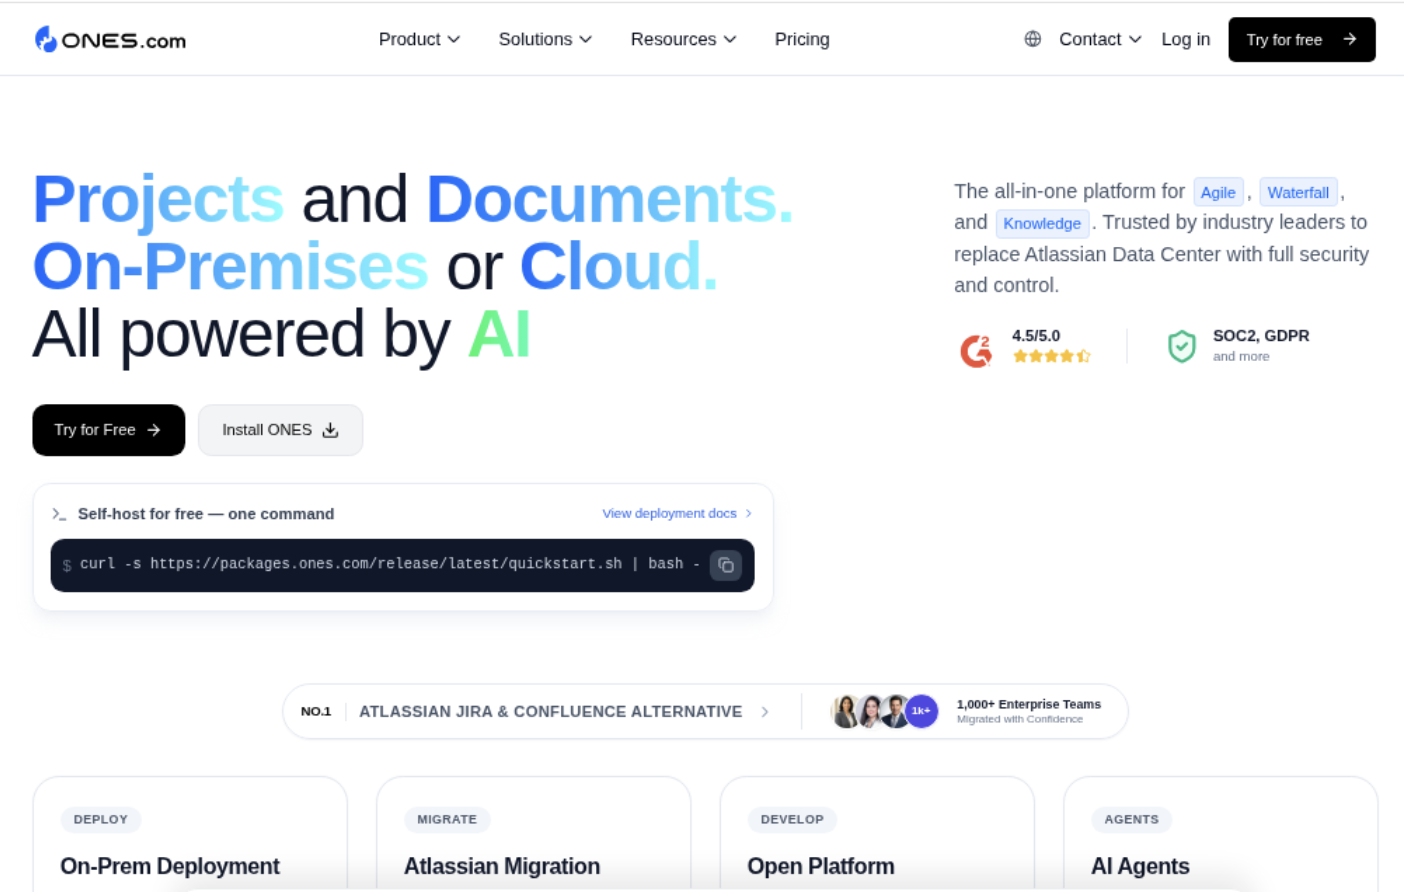
For teams evaluating their reporting setup, the key question is whether Jira plus eazyBI still fits the wider workflow. ONES Project may suit teams seeking project management, reporting, and configurable workflows in one environment. ONES Project and ONES Wiki are sold separately.
Core Capabilities
- Reporting spread across separate systems: ONES Project includes built-in reporting → teams can review project status within their project management environment.
- Workflows that do not match team practice: Custom workflows and fields let teams reflect their process → reports can follow the stages and details the team actually uses.
- Sprint progress requires extra assembly: Sprint management supports planning and tracking → teams can review sprint work alongside project activity.
- Repeated manual updates slow routine work: Automation handles configured workflow actions → teams can reduce repetitive steps and keep work moving.
- Jira migration creates workflow concerns: Jira-compatible workflows can ease transition planning → teams can assess a Jira alternative without discarding familiar process patterns.
- Plugin stacks add maintenance overhead: Native capabilities cover project management and reporting needs → teams may reduce reliance on multiple add-ons.
- Restricted hosting requirements limit choices: Cloud, on-premise, private cloud, and air-gapped deployments are available → organizations can select an environment that fits their operating requirements.
- Self-hosted teams worry about feature gaps: Cloud and self-hosted versions have full feature parity → deployment choice does not require giving up feature access.
Application Scenarios
A software team using Jira and eazyBI may keep its existing setup when custom analytics are central to planning. If it is also managing workflow configuration, plugins, and reporting across several systems, it can compare that setup with ONES Project’s built-in project capabilities.
An organization with restricted network requirements may consider an air-gapped or on-premise deployment. A smaller team evaluating project management can also begin with the free plan, which supports up to 30 seats.
Common Challenges When Building Reports
- The report shows unexpected totals. Check the project scope, date range, issue status rules, and selected measure. Compare a few results with matching Jira issues before sharing the view.
- A custom field is missing. Review the eazyBI import settings and confirm the field is available for analysis. After changing import configuration, run an import and test the report again.
- Stakeholders interpret a metric differently. Add a plain-language definition beside the report. For example, clarify whether “completed” means resolved, closed, or completed within a sprint.
- The dashboard feels crowded. Remove charts that do not support a decision. Keep the most important trend visible, then provide a focused table for people who need details.
- People disagree about freshness. State when the latest import ran and set an update cadence that fits the meeting. A daily review may need fresher information than a quarterly trend report.
Frequently Asked Questions
What can I report on with eazyBI for Jira?
You can analyze Jira issues using measures such as issues created, issues resolved, and story points, then group or filter them by dimensions such as project, time, assignee, issue type, or sprint. The available details depend on your import configuration and the Jira fields you choose to include. Start with one question and confirm the relevant fields are available before designing a complex report.
How do I add an eazyBI report to a Jira dashboard?
Save the report in eazyBI, then use the available dashboard integration to add it to a Jira dashboard. The exact controls can vary by Jira and eazyBI setup. Before sharing the dashboard, check that its viewers have the required permissions and can access the projects represented in the report.
Why are my eazyBI report results different from Jira?
Differences often come from date ranges, filters, status definitions, import timing, or the way a measure is grouped. Check the report’s project and time filters first, then compare a small set of matching issues in Jira. If you recently changed import settings or fields, run an import and review the result again.
Can I create custom metrics in eazyBI?
Yes. eazyBI supports calculated measures using MDX, which can express custom ratios and other reporting logic. Define the calculation in plain language first, including the period and issue groups it should use. Then test it with examples your team can verify, and label the finished metric so viewers understand what it means.
When should I consider a Jira alternative with built-in reporting?
Consider an alternative when maintaining separate project management, workflow, and reporting tools creates ongoing friction. Compare the reporting questions your team needs, its workflow requirements, and any hosting constraints. If custom analytics are essential, your current Jira and eazyBI setup may remain appropriate; if consolidating capabilities matters more, evaluate platforms such as ONES Project.
Conclusion
Building a useful eazyBI Jira report starts with a clear question. Choose the right measure, dimension, and filters, then verify the result against Jira before sharing it with your team.
When reports feel confusing or unreliable, check their scope, definitions, and refresh timing before adding more charts. A simple view that supports a real decision is more valuable than a crowded dashboard that leaves people guessing.
With a repeatable reporting process, you can spot project trends sooner and make conversations more specific. If your wider workflow needs a different setup, compare your current Jira and eazyBI arrangement with platforms that include project management and reporting capabilities.