A Practical Guide to Jira Status Transitions in Power BI
Need more than a Jira status snapshot? Build a Jira workflow status transitions Power BI report to uncover delays and reopens. Read now to learn how.
Jira can show you an issue’s current status, but that snapshot won’t tell you how the work got there. When you need to explain delays, reopens, or time spent waiting, status transitions matter more than a simple count of tickets.
That gap can make a Power BI report misleading. A ticket marked “Done” today may have spent weeks blocked, and a reopened issue can disappear inside a current-status chart. If you compare teams without accounting for those movements, you may mistake process differences for performance problems.
But here’s the truth: you can build a useful Jira status transition report by capturing each status change as an event, shaping those events in Power Query, and modeling them clearly in Power BI. I’ll walk you through the workflow, the measures that answer practical questions, and the checks that keep your results trustworthy.
A practical workflow for reporting Jira status transitions in Power BI
Start with Jira’s issue history, not just each issue’s current status. A transition record should identify the issue, its previous status, its new status, and when the change happened.
Here’s the workflow at a glance. Each step creates a clear foundation for the next one.
- Choose the questions. Decide whether you need transition counts, time in status, cycle time, reopen rates, or bottleneck trends.
- Retrieve status history. Use a Jira connector or the Jira REST API to obtain issue changelog events for the projects and dates you need.
- Shape transition events. In Power Query, keep relevant status changes, normalize names and timestamps, and check for duplicate events.
- Build the model. Relate the transition-event table to issue, project, user, and calendar dimensions where those details are available.
- Create measures and visuals. Add metrics that answer your questions, then show trends and breakdowns with clear filters.
- Validate and refresh. Compare selected issues with their Jira histories and confirm that refreshes include recent changes.
For example, a team investigating slow delivery might compare average time in “In Progress” with time in “Review.” That comparison becomes possible when the report retains each transition timestamp.
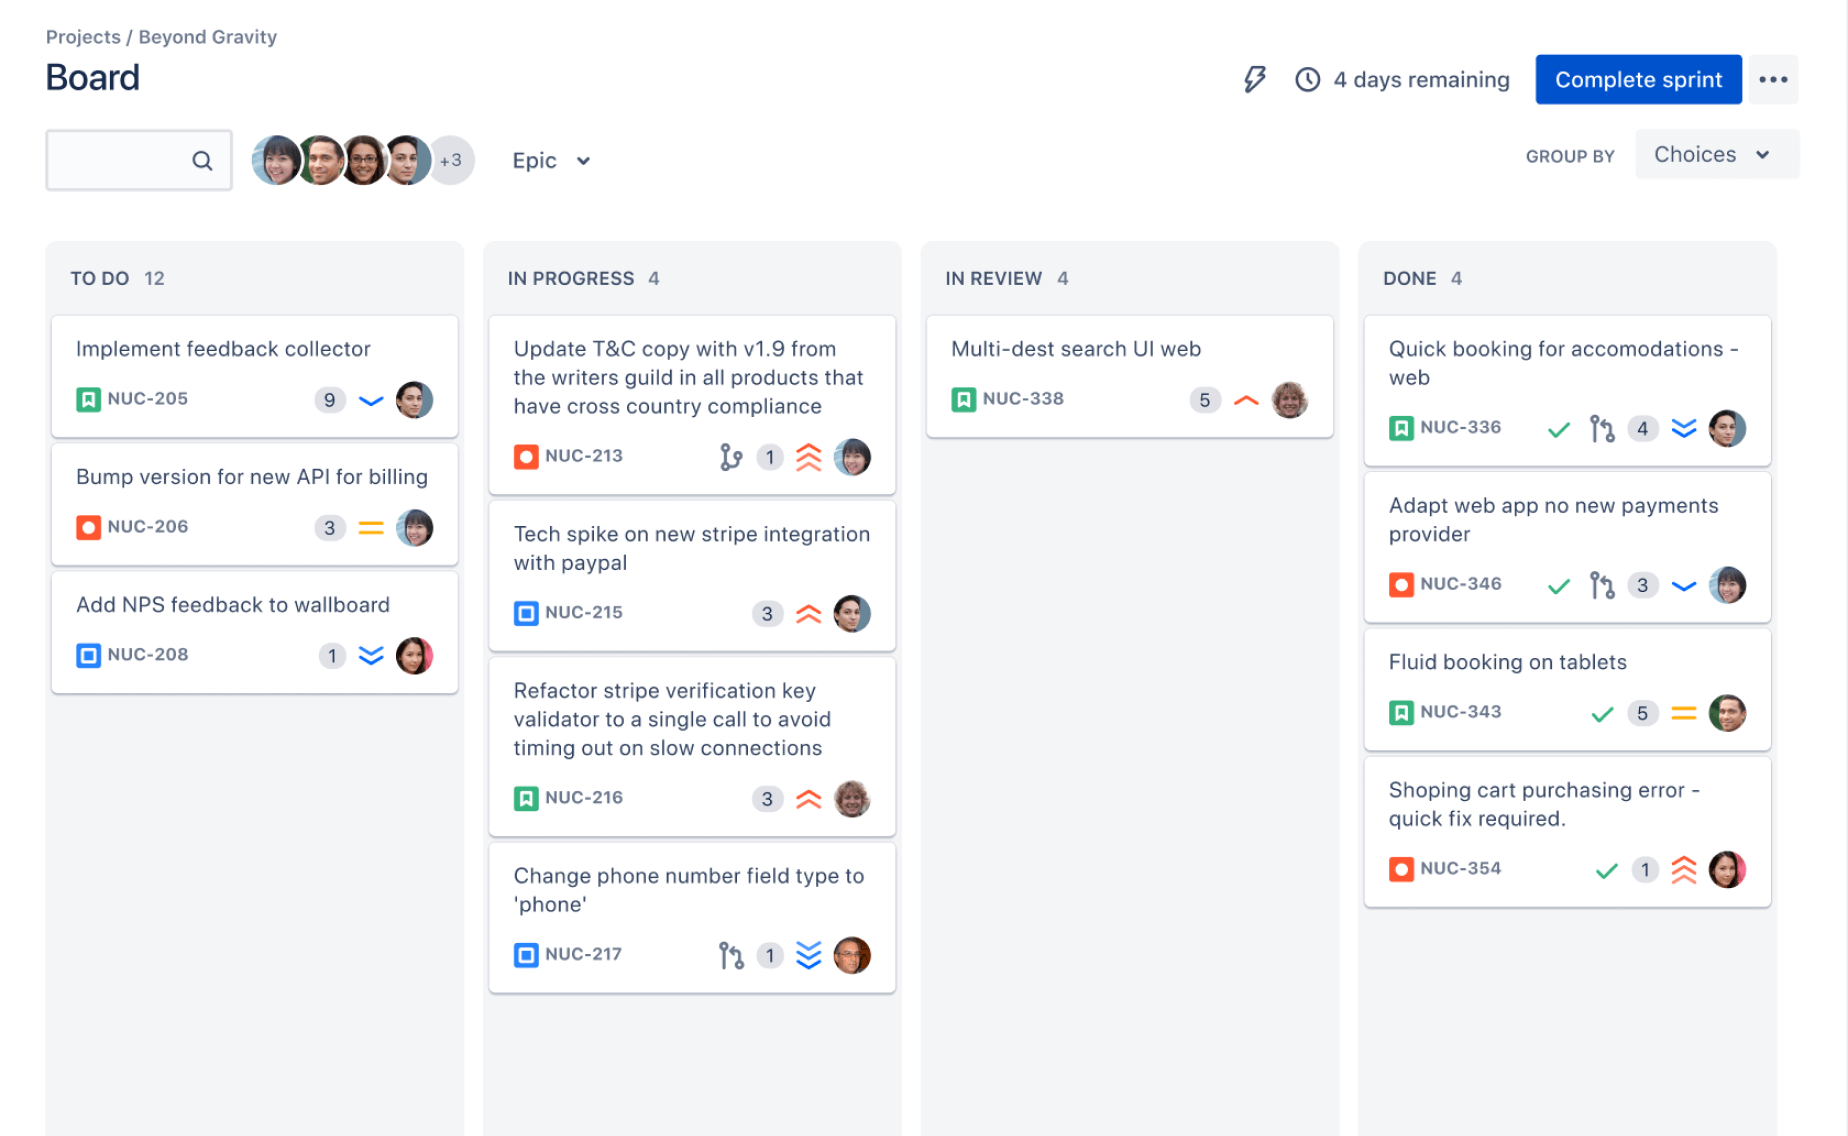
What a transition event should contain
A status transition is a recorded change from one Jira status to another. It is different from a current-status snapshot, which only tells you where an issue stands now.
Here’s why: if an issue moves from “To Do” to “In Progress,” then “Review,” and finally “Done,” its latest status alone hides the earlier steps. The history lets you examine the path and its timing.
At minimum, capture an issue identifier, the old status, the new status, and the transition timestamp. Project, issue type, assignee, sprint, and resolution can add useful context, but their availability depends on your Jira setup and retrieval method.
Check the shape of Jira history
Jira changelogs record changes over time, but retrieval details vary with the API, connector, permissions, and Jira deployment. For Jira Cloud, the REST API provides issue changelog endpoints; large retrieval jobs may require pagination.
Before building visuals, inspect several real issues. Confirm that status changes appear in chronological order and that timestamps include enough precision for your reporting needs.
Also decide how to treat status renames. If “QA” later becomes “Testing,” you may want a consistent reporting label so a naming change does not look like a new process stage.
Collect and prepare Jira history
Pick a retrieval method that fits your environment. A maintained Jira connector may simplify authentication and refresh, while a REST API approach can give you more control over fields and pagination.
Let me explain: neither route removes the need to understand what the returned history represents. Test access with a small set of issues before requesting a large project history.
Retrieve enough history for your questions
Set a sensible scope, such as selected projects and a reporting period. If you need cycle time for issues completed this month, retrieve enough earlier history to capture when those issues entered active work.
A date filter on transition events may not be enough by itself. An issue completed in May could have entered “In Progress” in April, so include the earlier event needed to calculate its duration.
Shape events in Power Query
Keep one row per status change. Useful columns include issue key, transition timestamp, previous status, new status, project key, and any stable issue attributes you plan to use in slicers.
- Set the timestamp type explicitly and confirm the time zone used by Jira and Power BI.
- Sort events by issue and transition time before calculating the next status or duration.
- Remove duplicate records only after checking whether they are genuine repeated events.
- Standardize status labels through a mapping step, while preserving the original label for troubleshooting.
- Retain non-status changes only if they support a specific reporting question.
Power Query can group records by issue, sort each group, and add an index. That index helps you connect one event to the next event for the same issue.
Model transitions and calculate useful measures
A simple model separates transition events from descriptive details. Keep the event table at one row per status change, then relate it to dimensions such as issue, project, and calendar.
The best part? A clear model makes the report easier to explain. A project filter can narrow the issues, while a calendar filter can focus the transition dates.
Calculate time spent in a status
For each event, find the next transition timestamp for the same issue. The difference between those timestamps represents the time between status changes.
For instance, if an issue entered “Review” on Monday at 10:00 and moved to “Done” on Wednesday at 10:00, its elapsed review time is 48 hours. If the issue has no later event, its current-status duration continues until your selected reporting cutoff.
Choose whether to report elapsed hours, calendar days, or working time. These measures answer different questions; a 48-hour weekend wait may not equal two working days.
Use measures that match the question
- Transition count: counts status-change events within the selected period.
- Average time in status: averages the duration for issues that entered a chosen status.
- Median time in status: shows a typical duration when a few unusually long issues skew the average.
- Reopen rate: measures how often completed work returns to an active status, using a clearly defined rule.
- Throughput: counts issues reaching a selected completion status during a period.
Write down each metric’s definition beside the report or in its help text. For example, “throughput” might mean issues entering “Done” during the week, not issues created during that week.
Design visuals that reveal delays and change
Put the main question in the first visual. If you are investigating where work waits, show median time in status by stage before adding detailed issue-level views.
A bar chart can compare “In Progress,” “Review,” and “Blocked.” A line chart can show whether median review time is rising week by week. A table with issue keys and durations helps a team inspect exceptions.
Give viewers useful context
Add filters for project, issue type, assignee, sprint, and date when those dimensions are relevant and available. Keep default selections visible so viewers know which period and teams the report covers.
Be careful with a funnel visual that implies every issue follows the same sequence. Real Jira workflows may include skipped stages, direct transitions, reopened work, or project-specific statuses.
For a concrete example, a review-time chart might reveal that most issues take one day, while a handful wait more than ten days. A median and an issue-level detail view help distinguish a broad slowdown from isolated exceptions.
Validate refreshes and interpret results carefully
Before sharing the report, choose several Jira issues with different histories. Compare their transition sequence and timestamps with the report, including at least one reopened issue and one issue still in progress.
You might be wondering: why check individual issues when the totals look right? Aggregated counts can conceal missing history, repeated events, or a time-zone shift.
Check refresh and history coverage
Confirm that scheduled refreshes can authenticate and retrieve the required history. If the retrieval method uses pagination, verify that later pages are included rather than assuming the first response contains every event.
Decide how to handle edits, deleted issues, renamed statuses, and changes made outside the reporting window. Record these rules so viewers can interpret results consistently.
Separate process signals from individual judgment
A long duration in “Blocked” may reflect an external dependency rather than an individual’s performance. Use transition metrics to investigate workflow conditions, then discuss the issue context with the team.
Compare like with like where possible. A support project with urgent interruptions may have a different status pattern from a planned product sprint.
When a project platform may simplify the workflow: ONES.com
ONES.com is a unified platform for project management and knowledge management. ONES Project handles project management and can be considered as a Jira alternative; ONES Wiki handles knowledge management and can be considered as a Confluence alternative. They are sold separately.
If your team already relies on Jira and Power BI, you can continue with that setup and build the reporting workflow above. If you are reviewing your project platform as well, ONES Project offers custom workflows, fields, sprint management, automation, and built-in reporting.
Where ONES Project can help
- Workflow differences slow reporting. Jira-compatible workflows let teams map familiar processes while adapting stages to their work, helping keep project tracking consistent.
- Teams need more than standard fields. Custom fields and workflows let you represent project-specific details, making issue records more useful for planning and review.
- Sprint work is hard to coordinate. Sprint management supports planning and tracking work across iterations, giving teams a clearer view of delivery progress.
- Repeated actions take manual effort. Automation can handle eligible routine actions, reducing repetitive work when teams configure rules around their process.
- Reports require too many add-ons. Built-in reporting provides project insights within the platform, which may reduce reliance on plugins for common reporting needs.
- Self-hosting is a requirement. ONES.com offers Cloud, On-Premise, Private Cloud, and Air-gapped deployments, giving teams deployment options for different environments.
- Cloud and self-hosted teams need comparable features. ONES.com provides full feature parity between cloud and self-hosted versions, helping teams choose a deployment without giving up feature access.
- A team wants to evaluate before expanding. The free plan supports up to 30 seats, giving a smaller group room to assess whether the platform fits its workflow.
Concrete scenarios to consider
A software team with a familiar Jira-style workflow could evaluate ONES Project when plugin maintenance and fragmented reporting have become difficult to manage. Built-in reporting and automation may help with common needs, while the team should verify any specific Power BI integration requirements before changing systems.
A company with restricted network requirements could assess an On-Premise, Private Cloud, or Air-gapped deployment. It can compare its operational and reporting needs with the available deployment options before planning a migration.
ONES.com is worth considering when project management requirements are part of the problem you are solving. For a Power BI report alone, first confirm the Jira history, event model, and metric definitions.
Common challenges and practical fixes
Only current status appears in the report
Problem: The report shows each issue’s latest status but cannot reveal previous stages or time spent there.
Fix: Retrieve changelog events and model one row per transition. Validate that the history includes the earlier events required for your reporting period.
Time-in-status values seem incorrect
Problem: Durations are negative, unexpectedly long, or inconsistent with Jira.
Fix: Sort events by issue and timestamp, confirm time zones, and check duplicate events. Test the duration calculation against a few known issues.
Historical status names do not align
Problem: A renamed or project-specific status splits one stage into multiple categories.
Fix: Create a deliberate status mapping for analysis. Keep the original label available so you can trace unexpected results.
Reopened work distorts completion metrics
Problem: An issue can enter “Done,” reopen, and reach “Done” again, making a simple count ambiguous.
Fix: Define whether throughput counts each completion transition or each issue completed in the period. State the rule clearly in the report.
FAQs about Jira transition reporting in Power BI
Can I report Jira status transitions using only the current issue status?
No. Current status describes the issue’s latest state, while transition reporting requires the history of status changes. Retrieve Jira changelog events or use a connector that exposes them. Then model each change as an event with its timestamp, previous status, and new status.
How do I calculate time spent in each Jira status?
For each issue, sort its status transitions by timestamp. Calculate the difference between an event and the next event to measure the time spent in the status entered by that event. For an issue that has not transitioned again, use a defined reporting cutoff. Decide whether your measure uses elapsed time or working time.
Why does my Power BI transition count differ from Jira?
Check the report’s date range, project filters, permissions, pagination, and refresh timing. Also confirm whether you are counting transition events or distinct issues. Those metrics can differ when an issue enters the same status more than once or gets reopened.
Should I use average or median time in status?
Use the measure that best represents the question. The average reflects all durations but can be pulled upward by a small number of long waits. The median shows the middle observation and can better describe a typical issue when durations vary widely. Showing both can add context, especially when investigating outliers.
Conclusion
A useful Jira status transition report starts with complete changelog events, a clear event model, and metrics with written definitions. Build from one transition row per status change, calculate durations carefully, and verify the results against real Jira issues.
When the report reveals delays, treat them as prompts for investigation rather than instant judgments. A clear view of status history helps your team understand where work waits, how often it returns, and which workflow changes deserve attention.