A Practical Guide to Tracking Jira Metrics in Agile Teams
Struggling to tell if delivery is improving? Track Jira metrics to uncover bottlenecks and make better Agile decisions. Read now to learn how.
Agile teams can collect plenty of Jira metrics and still struggle to explain whether delivery is improving. A rising issue count may look productive, while unfinished work and growing delays tell another story.
When a team treats every chart as a target, people may change how they work simply to improve the numbers. That can hide bottlenecks, encourage rushed estimates, and make sprint reviews less useful.
But here's the truth: metrics help when they answer a real delivery question and prompt a constructive conversation. This guide shows you which Jira metrics to track, how to interpret them, and how to avoid common measurement traps.
You’ll also see practical ways to turn dashboard trends into small experiments your team can review together. The goal is clearer decisions, healthier workflows, and more dependable delivery—not a prettier chart.
What Jira Metrics Tell You About Agile Delivery
Jira metrics are measurements drawn from a team’s work items and workflow history. They can help you understand delivery pace, predictability, work in progress, and quality over time.
A chart cannot explain why a sprint changed or whether a delay was avoidable. Your team supplies that context through discussion, workflow knowledge, and careful review of trends.
For example, a longer cycle time might point to overloaded reviewers, work items that are too large, or a temporary increase in complex tasks. The metric identifies a question worth investigating; it does not diagnose the cause by itself.
Here's why: each metric describes only part of the delivery system. Pair a speed measure with a quality or workflow measure, then discuss what the combination means for your team.
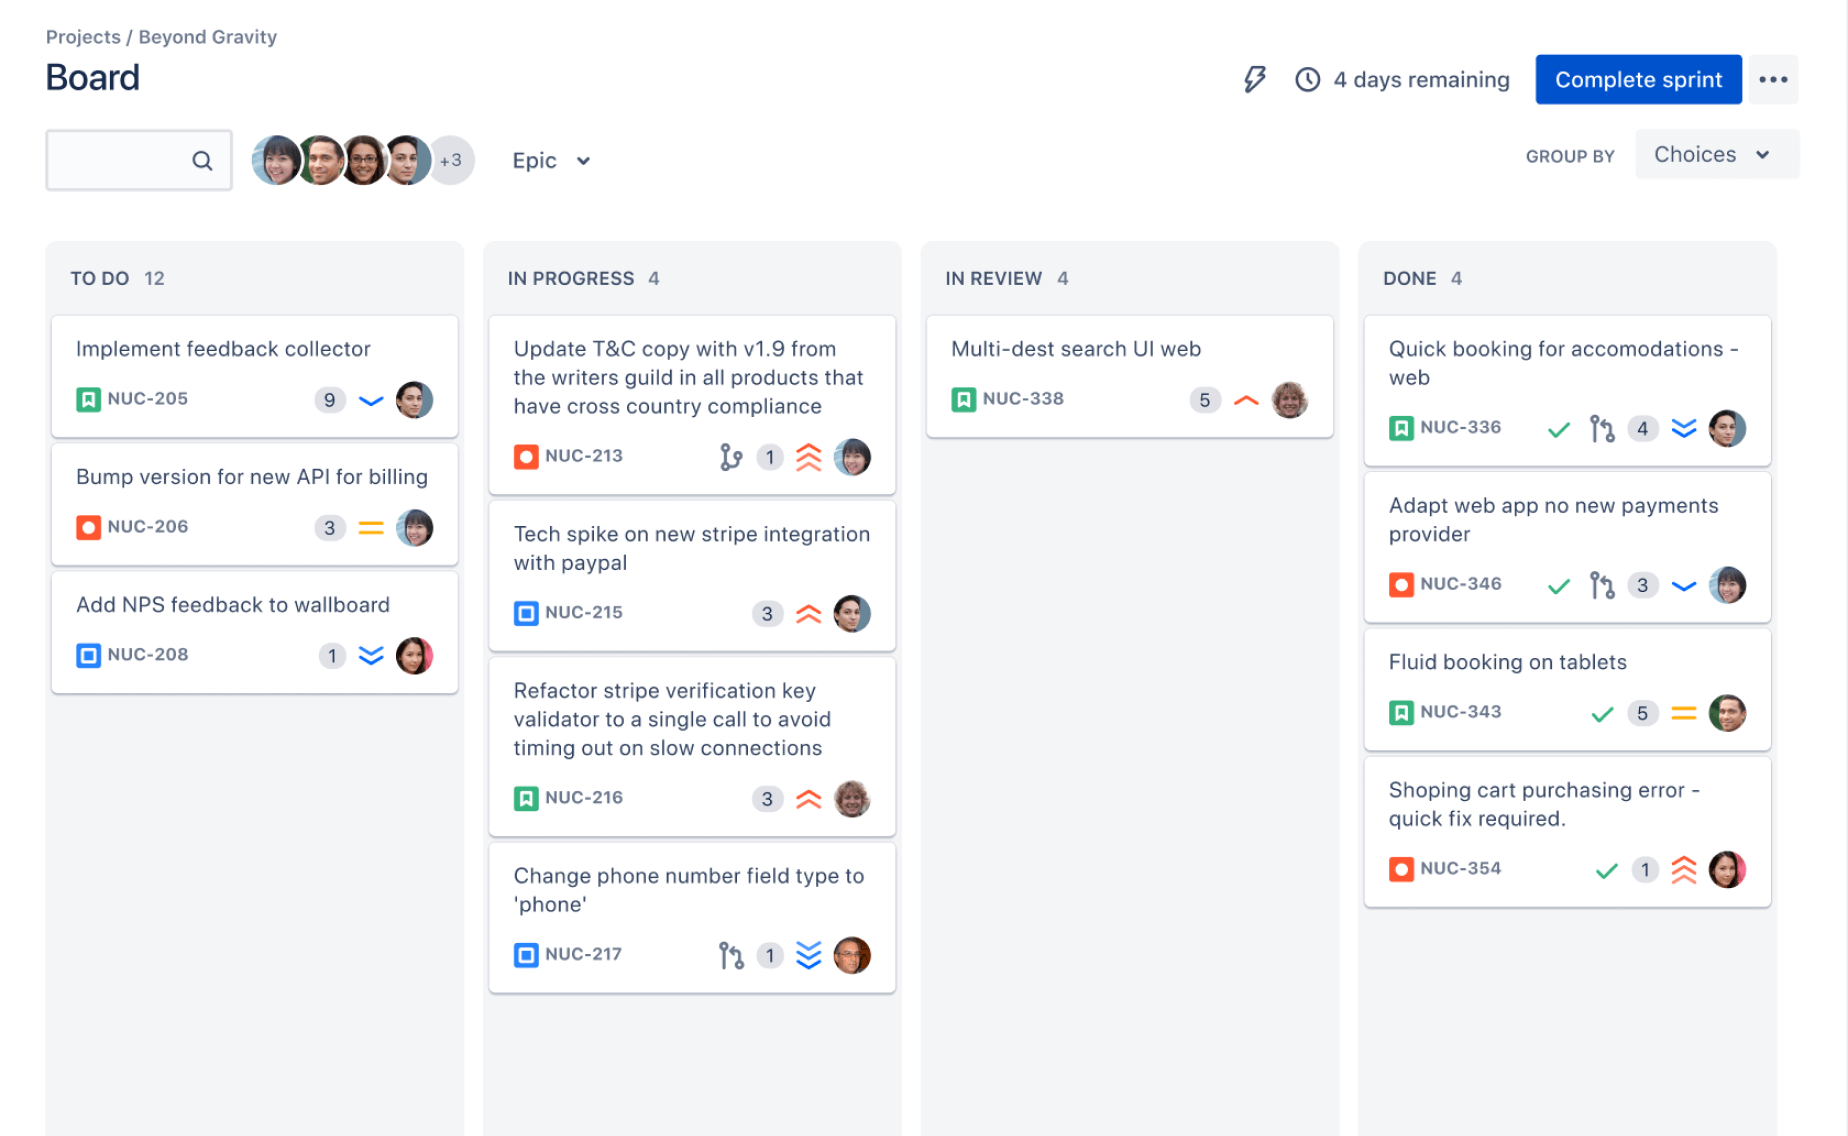
Choose Metrics That Match Your Team’s Questions
Start with a question your team actually needs to answer. A useful metric connects directly to a decision, such as whether to limit work in progress or investigate delayed reviews.
For example, if stakeholders often ask when a feature will be ready, lead time may be more relevant than sprint velocity. If work stalls after development, cycle time and blocked-work trends may help your team find the handoff causing delays.
Keep the first set small. A team might review cycle time, throughput, and escaped defects, then add another measure only when a clear question calls for it.
Separate diagnostic measures from targets
Use metrics to notice patterns and guide investigation. Avoid setting an arbitrary target for individual output, such as expecting every developer to close a fixed number of issues each week.
Work items vary in complexity, and teams often collaborate across roles. A target tied to issue counts can reward splitting work into smaller tickets without improving customer outcomes.
Key Jira Metrics and How to Read Them
Each measure has a different purpose. Before adding a chart to your dashboard, agree on what it counts and what decisions it may inform.
Cycle time
Cycle time measures how long a work item takes from a defined start point to completion. A team might measure from “In Progress” to “Done,” provided those statuses match its actual workflow.
If the median cycle time rises for several weeks, inspect aging work and handoffs. A few unusually large items can affect an average, so a median may better represent a typical task.
Lead time
Lead time measures elapsed time from a request entering the team’s process to delivery. It includes waiting before active work begins, making it useful when stakeholders want to understand end-to-end responsiveness.
Suppose a request waits six days in a queue and takes four days to complete. A cycle-time chart may show four days, while lead time reflects the ten-day wait experienced by the requester.
Throughput
Throughput counts the number of work items completed during a period. Define what qualifies as a completed item and keep that definition steady when comparing weeks or sprints.
A team finishing 18 items one sprint and 12 the next has seen a change worth exploring. The counts alone do not prove that one sprint was better; item size, work type, and interruptions matter.
Velocity
Velocity is the amount of estimated work a Scrum team completes in a sprint, often expressed in story points. Teams commonly use it to inform their own planning after observing several sprints.
Story points are relative estimates, so velocity is not a reliable way to compare separate teams. If estimates change or the team composition shifts, discuss those changes before using past velocity to plan.
Burndown and burnup
A burndown chart shows remaining work over a sprint or release. A burnup chart shows completed work against the total scope, making scope changes easier to notice.
For example, if the burnup’s scope line rises midway through a sprint, the team can distinguish added work from slower completion. That makes the chart more useful in a review conversation.
Work in progress and cumulative flow
Work in progress (WIP) is the amount of work currently underway. A cumulative flow diagram shows how items accumulate across workflow stages over time.
If the “In Review” band keeps widening, review capacity may be falling behind development. The team could test a review limit or rotate reviewers, then check whether work flows more smoothly.
Escaped defects and rework
Escaped defects are issues discovered after work reaches a later stage, such as production. Rework measures effort spent correcting or revisiting completed work, when teams can define and track it consistently.
A sudden rise can prompt a discussion about testing, acceptance criteria, or changes in release risk. Pair the trend with examples of defect impact so the team understands what the count means.
Set Up a Useful Metrics Review
A reliable review begins with consistent workflow definitions. If “Done” means tested for one team and merely coded for another, their completion metrics describe different events.
Agree on status transitions, reporting periods, and issue types before comparing results. Then confirm the charts include the work your team wants to understand, such as incidents or support requests when those affect delivery.
- Choose a question. Write down the delivery concern, such as work waiting too long for review.
- Select one or two measures. Choose measures that can illuminate the concern without overwhelming the discussion.
- Check definitions. Confirm start and end points, issue types, and reporting windows.
- Review the trend. Compare several periods and note unusual changes or shifts in scope.
- Agree on an experiment. Pick a small workflow change, assign an owner, and set a review date.
Keep the conversation focused on the system of work. If cycle time increases, ask where items wait and what changed before asking who completed them.
The best part? A team does not need to redesign its entire process after seeing one unusual chart. A small experiment, such as a daily review rotation, can produce a clearer next signal.
Interpret Trends Without Misleading Your Team
Metrics can shift for reasons that have little to do with team performance. A production incident, new approval step, holiday period, or change in work mix may affect a chart.
Compare similar periods where possible, and annotate important events. For example, a release week with urgent fixes should not be interpreted as an ordinary sprint without noting the interruption.
You might be wondering: how long should you wait before acting on a trend? There is no universal cutoff. Look for a pattern across multiple observations, then check it against the team’s firsthand experience.
Use metrics as prompts, not verdicts. If the numbers and the team’s experience disagree, investigate the definitions, workflow events, and missing context before drawing a conclusion.
Jira Metrics Solution: ONES.com
ONES.com brings project management and knowledge management into a unified platform, with ONES Project handling project work. ONES Project is a Jira alternative for teams that want compatible workflows, reporting, and flexible configuration.
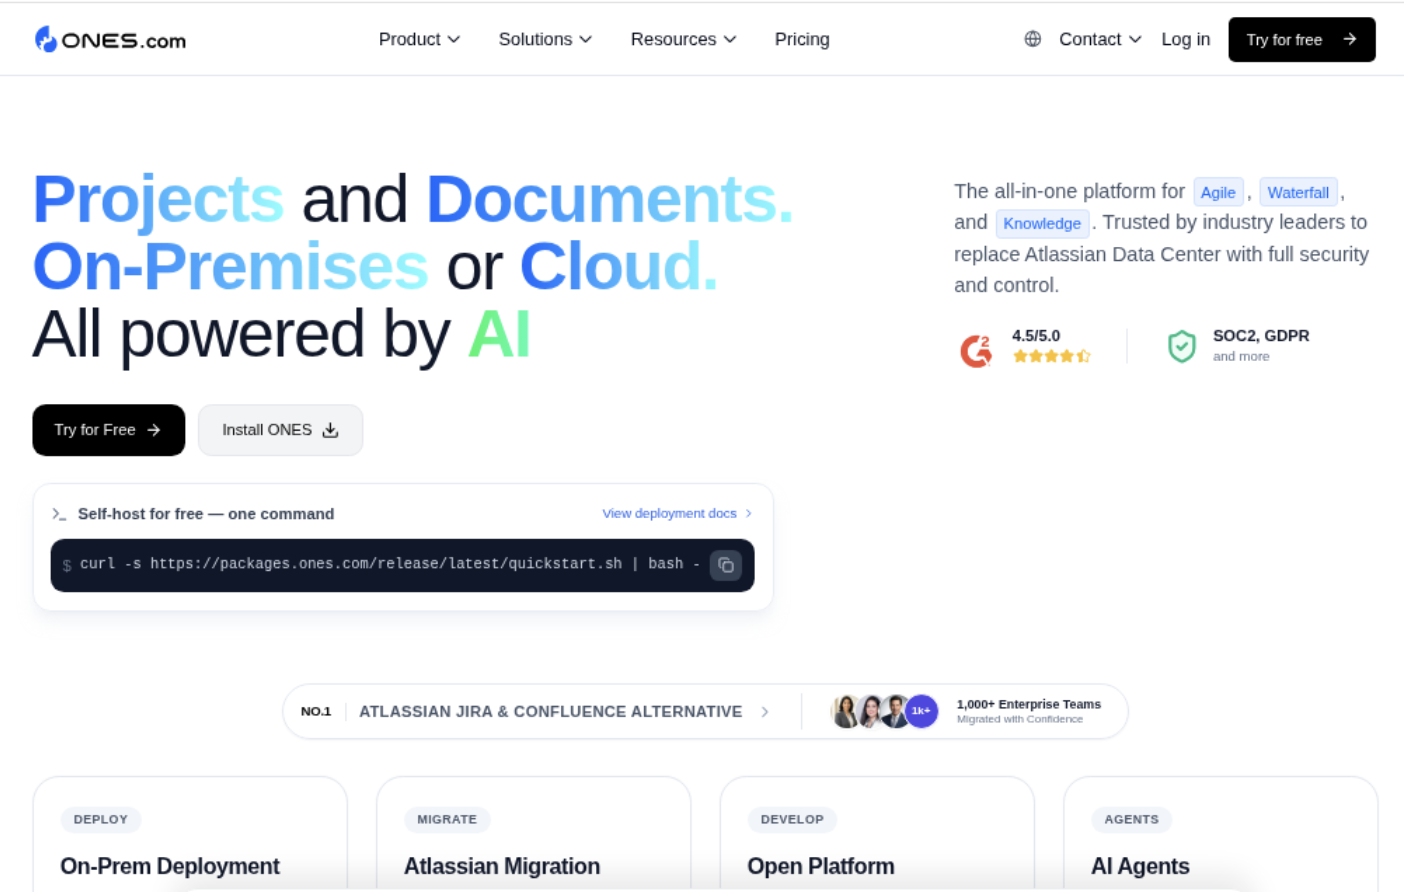
ONES.com may suit teams evaluating how their project workflows and reporting fit together. ONES Project and ONES Wiki are sold separately, so you can select the project or knowledge management product relevant to your needs.
Core capabilities
- Pain: Teams need to understand work progress without manually assembling every status update. ONES capability: Built-in reporting. Result: Teams can review project progress in the platform.
- Pain: A rigid process can make status information less meaningful. ONES capability: Custom workflows and fields. Result: Teams can shape work tracking around their delivery stages.
- Pain: Sprint planning and delivery tracking can become disconnected. ONES capability: Sprint management. Result: Agile teams can organize sprint work in the same project environment.
- Pain: Repeated manual actions take time and may be missed. ONES capability: Automation. Result: Teams can automate selected workflow tasks.
- Pain: Moving from Jira can raise concerns about familiar processes. ONES capability: Jira-compatible workflows. Result: Teams can preserve compatible ways of working during evaluation.
- Pain: Plugin-heavy setups can make administration harder. ONES capability: Native project management features. Result: Teams may rely on fewer plugins for supported needs.
- Pain: Teams in restricted environments may need local deployment. ONES capability: Cloud, On-Premise, Private Cloud, and Air-gapped deployment options. Result: Organizations can consider a deployment model that matches their environment.
- Pain: Self-hosting can raise concerns about feature differences. ONES capability: Full feature parity between cloud and self-hosted versions. Result: Teams can evaluate deployment without planning around a reduced feature set.
Application scenarios
A Scrum team could use ONES Project’s sprint management and reporting to review delivery trends, then adjust custom fields to reflect its workflow. The team should still agree on metric definitions before comparing periods.
An organization operating in a restricted network could evaluate an Air-gapped or On-Premise deployment. A team documenting its practices separately could also consider ONES Wiki as a Confluence alternative, while keeping in mind that the products are sold separately.
Common Challenges When Tracking Agile Metrics
- Changing definitions: A status meaning changes, making old and new reports hard to compare. Solution: Record the team’s definitions and review them whenever the workflow changes.
- Too many charts: A dashboard becomes noisy, and important signals get overlooked. Solution: Keep measures tied to current questions and remove charts nobody uses.
- Gaming a target: People optimize ticket counts or estimates rather than improving delivery. Solution: Avoid individual rankings and discuss team-level trends with qualitative context.
- Misreading a short-term spike: One unusual sprint triggers a large process change. Solution: Check for interruptions, scope changes, and recurring patterns before responding.
- Comparing unlike teams: Different workflows and work types make headline numbers misleading. Solution: Use metrics primarily for a team’s own learning, with definitions and context attached.
FAQs About Jira Metrics
Which Jira metrics should an Agile team track first?
Start with measures that answer an immediate team question. Cycle time and throughput can help a team explore flow and completed work, while escaped defects can add a quality perspective. Scrum teams may also review velocity for their own sprint planning. Choose a small set, define each measure, and add more only when a decision requires additional insight.
Can Jira metrics compare the performance of different teams?
Use caution when comparing teams. Teams can have different work types, estimation habits, workflows, staffing, and definitions of completion. A velocity of 40 points for one team may not represent the same effort as 40 points elsewhere. Metrics are generally more useful for helping each team understand its own changes and identify improvements within its context.
How often should a team review its metrics?
Choose a review rhythm that fits the team’s planning cycle and the speed of change. A Scrum team might discuss relevant trends during sprint reviews or retrospectives, while a flow-based team may review them more frequently. The key is to leave enough time for a pattern to emerge and avoid turning every short-term fluctuation into a process change.
Why do Jira reports sometimes show different results?
Reports can differ when they use different date ranges, issue types, status definitions, or filters. Workflow changes can also affect which events count as a start or completion. Check the report settings and team conventions first. If the underlying definitions changed, annotate the shift before comparing periods so the team does not mistake a measurement change for a delivery change.
Should velocity be a productivity target?
Velocity works best as a planning aid for the team that created the estimates. It can help that team discuss how much planned work may fit into a future sprint after reviewing several sprints. Using it as a productivity target can encourage inflated estimates or unhealthy comparisons. Pair it with discussion of completed outcomes, scope changes, and sustainable workload.
Conclusion
Jira metrics can help your Agile team see delivery patterns, locate workflow delays, and ask better questions about quality. Start with a clear concern, choose a few relevant measures, and agree on what each one counts.
Then review trends with the people doing the work, account for unusual events, and test a small improvement. When charts become scorecards, they can distort behavior; when they support honest conversation, they can help teams make more dependable decisions.
You do not need a dashboard full of numbers to make progress. A thoughtful review of cycle time, throughput, or work in progress can be enough to identify one useful next step.