A Step-by-Step Guide to Creating Jira Burndown Charts
Unsure if your sprint is on track? Learn how to create and read a burndown chart in Jira—click to discover the steps now.
When a sprint is underway, it can be hard to tell whether your team is on track by looking at a task list alone. Work may be moving, yet the deadline is getting closer while too much effort remains.
That uncertainty can lead to late surprises, rushed scope cuts, and status meetings that rely on guesses. A Jira burndown chart makes sprint progress easier to see by comparing remaining work with the time left.
Here’s how to find and use one: prepare estimates on your Scrum board, open its Burndown Chart report, and select the sprint you want to review. Then read the trend, check for scope changes, and use what you learn to adjust the team’s plan.
How to Create and View a Burndown Chart in Jira
Jira generates the sprint burndown chart as a report; you generally don’t draw it manually. Use these steps to make sure the report has meaningful sprint information to display.
Open the Scrum board for your project. Confirm that it’s the board your team uses to plan and run the sprint. The report reflects that board’s issues and estimation settings.
Choose an estimation method. Jira can track work using story points or time estimates, depending on your board configuration. Pick the method your team uses consistently.
Estimate the sprint work. Add estimates to the issues you expect to complete. For example, a team using story points should estimate each relevant story or task before relying on the chart.
Set up the sprint. Add the intended issues, confirm the sprint dates, and start it. Jira needs a sprint to track progress over time.
Open the report. In Jira, go to the Scrum board’s Reports area and select Burndown Chart. The exact navigation can vary slightly between Jira project types.
Select the sprint. Choose the active sprint or a completed sprint from the report’s sprint selector. Check that the selected sprint matches the work you want to review.
Review the chart and its issue details. Compare the remaining-work trend with the ideal guideline. If the actual line behaves unexpectedly, inspect estimates, status changes, and added or removed work.
The best part? Once your team estimates work and uses the sprint board consistently, Jira updates the report as issues change. You can return to the same report during the sprint to discuss progress.
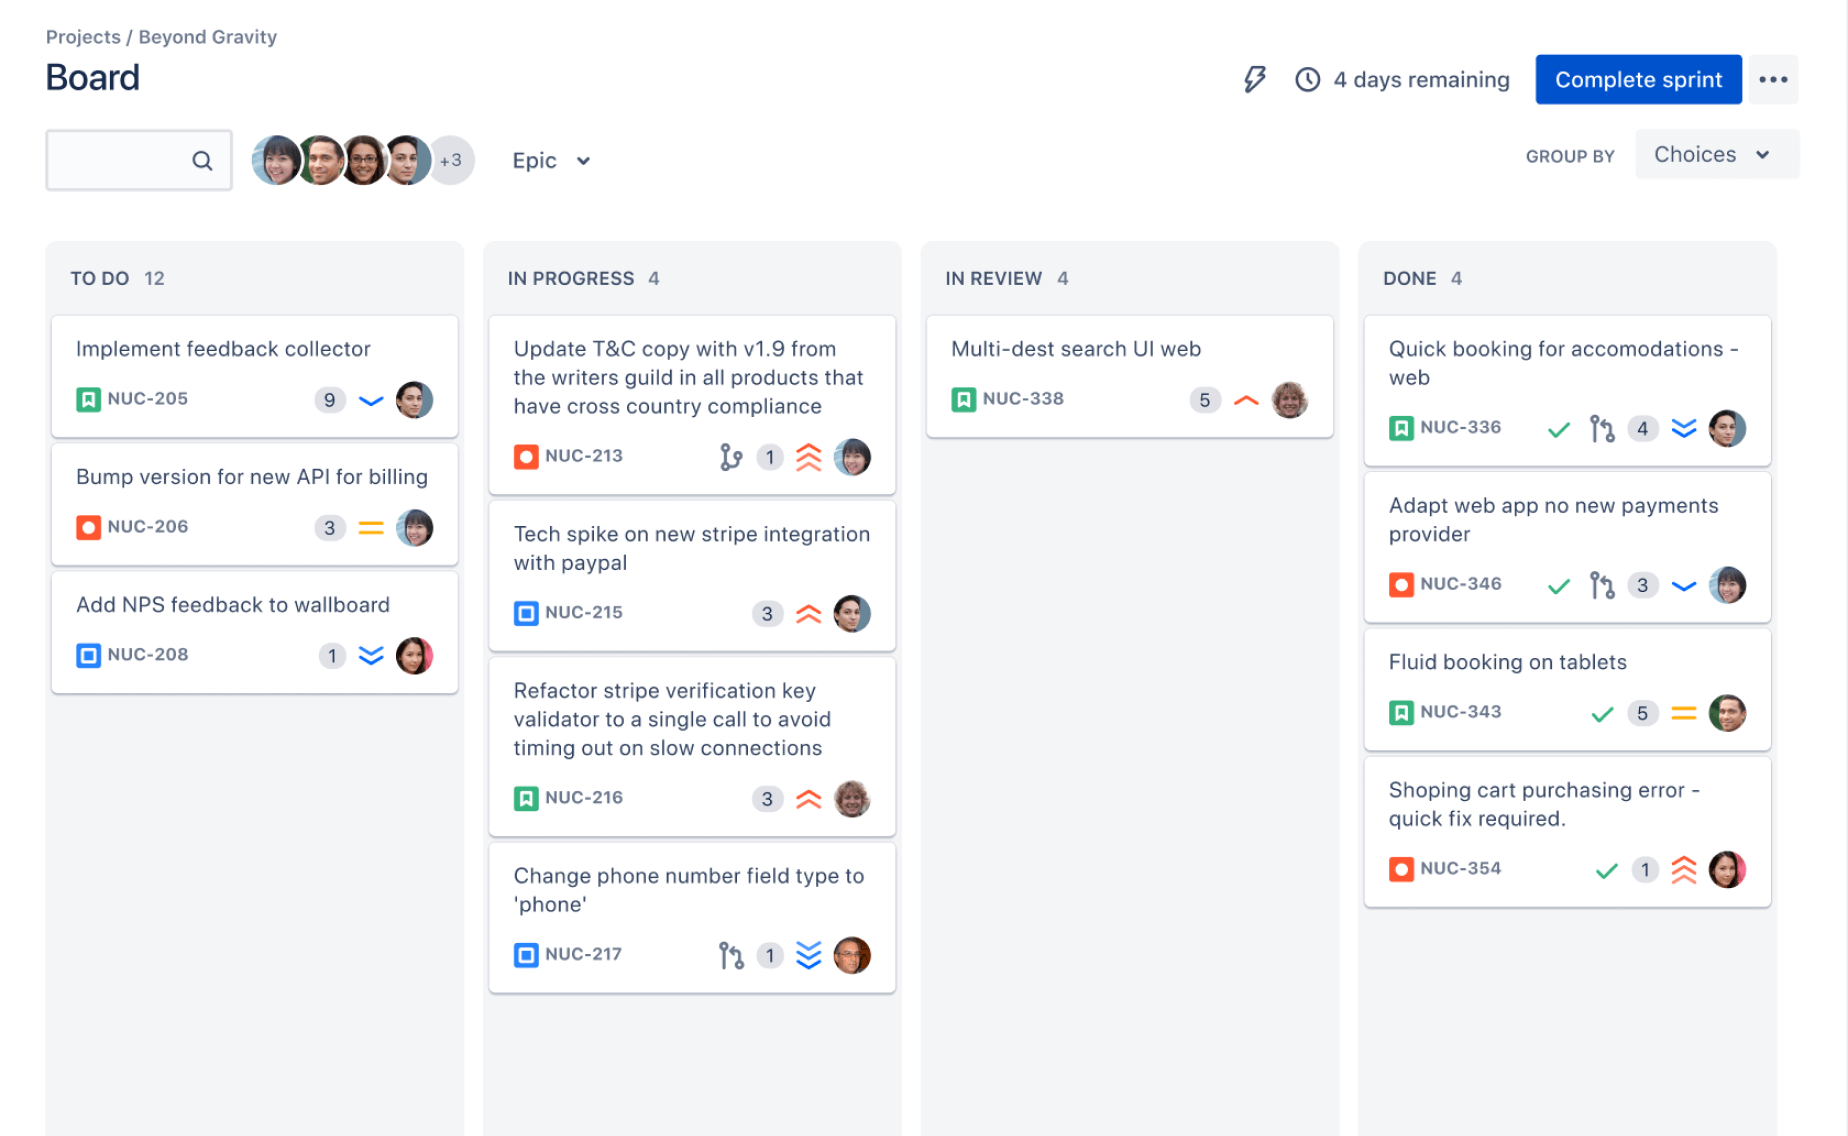
What Jira’s Sprint Burndown Chart Shows
A burndown chart tracks estimated work remaining across a sprint. The horizontal axis represents time, while the vertical axis represents the amount of work left to complete.
Jira displays an ideal guideline for how work might burn down over the sprint. The actual line reflects the remaining estimated work as issues are completed or the sprint’s scope changes.
Here’s why the distinction matters: the ideal line is a reference, not a promise. If the actual line stays above it, the team may have more work remaining than the guideline suggests. If the line jumps upward, new work or changed estimates may explain the increase.
For example, imagine a five-day sprint with 40 story points at the start. If the chart shows 32 points remaining halfway through, the team can discuss whether its pace, scope, or estimates need attention.
How to Read the Trend and Respond
Start by checking the sprint’s overall direction. A steady downward trend suggests that estimated work is being completed, while a flat stretch may mean no estimated issues have reached a completed status.
But don’t treat a single point as a verdict. A team might finish several large issues late in the sprint, creating a sharp drop. The chart shows the remaining estimate, not every conversation or dependency behind that movement.
Look for sudden increases
A rising line can indicate that work was added to the sprint, an estimate increased, or an issue’s status changed. Check the sprint’s issue list and recent updates before deciding what the change means.
Check whether work is counted consistently
If some issues lack estimates, or your team mixes estimation methods, the chart may not represent the full workload clearly. Agree on how to estimate stories, tasks, and other issue types before comparing sprint trends.
Use the chart to guide a conversation
Ask specific questions: Did the team add work after the sprint began? Is a blocked issue holding up completion? Has the team’s estimate changed? Those answers can lead to practical adjustments, such as removing a lower-priority task or resolving a dependency.
Practices for More Reliable Sprint Tracking
A useful chart starts with a useful sprint plan. Keep estimates consistent, confirm the sprint scope with the team, and make sure everyone understands what counts as completed work.
For example, if your team estimates stories in points, don’t switch to hours halfway through a sprint. A consistent method makes it easier to interpret the trend and compare it with the team’s own past work.
Estimate before the sprint starts. Add estimates during planning so the initial workload is visible from the beginning.
Keep statuses meaningful. Agree on when an issue moves to a completed status, and apply that rule consistently.
Record scope changes promptly. If the team adds or removes an issue, update the sprint so the report reflects the current plan.
Review progress regularly. Check the trend during stand-ups or sprint reviews, then investigate unusual changes rather than reacting to a single point.
Use completed sprints as context. Compare patterns across several sprints to spot recurring planning or delivery challenges. Avoid treating one sprint as a reliable forecast by itself.
Let me explain: the chart is most useful when the team treats it as a shared planning aid. It can highlight a concern, but the people doing the work still need to identify its cause.
Common Burndown Chart Challenges
The report looks empty or incomplete
Why it happens: The sprint may have no estimates, the wrong sprint may be selected, or the report may be using a different board than the team expects.
What to do: Confirm the Scrum board and sprint, review its estimation setting, and check that sprint issues have estimates. Then reopen the report and verify the selected sprint.
The line rises after sprint planning
Why it happens: The team may have added issues or increased estimates after the sprint started. A rise can reflect a real workload change rather than a reporting error.
What to do: Review scope and estimate changes with the team. Decide whether the work still fits the sprint, and update the plan if needed.
The chart does not match the team’s sense of progress
Why it happens: Issues may be partly complete but not marked complete, estimates may be missing, or the team’s workflow may not clearly define completion.
What to do: Check issue statuses and agree on a consistent completion rule. If your team needs to track partial progress, make sure its estimation and workflow practices reflect that need.
The team treats the ideal line as a deadline forecast
Why it happens: The guideline can look like a prediction, even though it represents an ideal pace rather than a guaranteed delivery schedule.
What to do: Use it as a comparison point. Discuss current workload, blockers, and scope changes before making decisions about delivery.
A Jira Burndown Workflow Solution: ONES.com
ONES.com brings project management and knowledge management together in one platform, powered by ONES Assistant. ONES Project is a Jira alternative for managing project work, while ONES Wiki is a Confluence alternative for team knowledge; the products are sold separately.
For teams reviewing sprint progress, ONES Project offers sprint management, custom workflows and fields, automation, and built-in reporting. These capabilities can support a structured tracking process, though you should confirm the specific report format your team needs before changing platforms.
Core capabilities
Workflows that don’t fit the team’s process: ONES Project supports custom workflows, helping teams represent their own issue stages and review steps.
Limited sprint planning options: Sprint management supports planning and tracking work across an iteration, giving the team a place to manage its sprint activity.
Repeated status updates: Automation can reduce recurring manual actions, helping teams keep routine workflow steps consistent.
Difficulty monitoring project activity: Built-in reporting gives teams a way to review project progress without relying solely on status conversations.
Teams moving from Jira: Jira-compatible workflows can make it easier to carry familiar ways of working into a Jira alternative.
Too many add-ons for core needs: A unified project management platform can reduce reliance on plugins for supported workflows and capabilities.
Requirements for controlled hosting: ONES.com is available in Cloud, On-Premise, Private Cloud, and Air-gapped deployments, giving organizations deployment choices.
Concerns about deployment differences: The cloud and self-hosted versions have full feature parity, so teams can select a deployment model without a feature split between them.
Application scenarios
A Jira-based team reviewing alternatives: A team that already runs Scrum can assess ONES Project’s Jira-compatible workflows, sprint management, and reporting against its current tracking needs. It should validate the reports it relies on before making a transition.
An organization with restricted network requirements: A company that needs On-Premise, Private Cloud, or Air-gapped deployment can evaluate ONES.com’s deployment options while planning how teams will manage projects and shared knowledge.
ONES.com offers a free plan for up to 30 seats. Its project and knowledge products are separate, so a team can assess ONES Project for project management without assuming ONES Wiki is included in the same purchase.
FAQs
Does Jira create a burndown chart automatically?
Jira provides a Burndown Chart report for Scrum boards, so you generally don’t need to build the chart manually. The report becomes useful when the sprint has dates, issues, and estimates that match the board’s estimation method. Open the board’s Reports area, choose Burndown Chart, and select the sprint you want to inspect. Navigation can differ slightly between Jira project types.
Why can’t I see a burndown chart in Jira?
First, confirm that you’re looking at a Scrum board and the correct report area. Then check that a sprint exists and that the relevant issues have estimates compatible with the board’s estimation setting. Also verify that you selected the intended sprint. If the report is still unavailable, your project type or board configuration may differ, so check the settings available to your Jira project.
What does an upward burndown line mean?
An upward line usually means the amount of estimated work remaining has increased. The team may have added issues to the sprint, raised estimates, or changed an issue’s status. Review the sprint’s changes before concluding that delivery has slowed. For instance, adding a five-point issue can raise remaining work even while the team continues completing other tasks.
Can a burndown chart predict whether a sprint will finish on time?
The chart can help your team discuss whether its current progress appears consistent with the sprint plan, but it cannot guarantee a completion date. Estimates, scope changes, blockers, and issue status all affect what the chart shows. Use it alongside team discussion and a review of remaining work. If a trend looks concerning, investigate the reason and agree on a response rather than relying on the line alone.
Conclusion
To view a burndown chart in Jira, open the Scrum board’s Burndown Chart report and select the sprint you want to review. Make sure the board uses a consistent estimation method and that sprint issues have estimates.
Then read the actual trend alongside the ideal guideline, checking for scope changes, blockers, or inconsistent issue updates. The chart can make sprint progress clearer, but a useful team conversation turns that visibility into action.
If Jira’s current setup doesn’t fit your team’s workflow or deployment needs, compare alternatives such as ONES Project with your reporting and sprint management requirements. Choose the approach that helps your team track work clearly and respond to changes early.