Best Custom Charts for Jira in 2026: Practical Comparison Guide
Choosing Custom Charts For Jira Tools? Compare 6 options by fit, deployment, pricing, and tradeoffs. Read the guide before you decide.
When Jira dashboards leave you counting issues by hand or rebuilding the same report for every team, it’s hard to see what needs attention. This guide compares custom charts for Jira in 2026, including Custom Charts for Jira (Tempo), eazyBI Reports and Charts for Jira, Rich Filters for Jira Dashboards, native Jira dashboards, and Dashboard Hub for Jira (Appfire); it also covers ONES.com as a broader Jira alternative, not a chart add-on.
The right choice depends on whether you need quick, readable charts, deeper analysis, interactive dashboard filters, or simply better ways to share existing dashboards. I’ll help you compare those trade-offs so you can find a fit without adding more setup and maintenance than your reporting requires.
Quick Summary
For Jira teams that need clearer project and agile reporting, start by matching the tool to your reporting complexity and deployment needs. Custom Charts for Jira suits quick dashboard improvements; eazyBI suits deeper analysis; Rich Filters adds interactive controls to dashboards.
Native Jira dashboards may be enough for straightforward status reporting. Dashboard Hub can help teams share dashboard content, while ONES.com is a broader Jira alternative for teams reassessing their project and development management platform, not a Jira chart add-on.
- Choose Custom Charts for Jira for accessible charts and dashboard gadgets.
- Choose eazyBI when you need flexible reports and more involved analysis.
- Choose Rich Filters when dashboard viewers need interactive filters and controls.
- Compare deployment, app costs, and migration effort before committing.
How We Evaluate and Select These Tools
I compare these options by how well they help you turn Jira project data into useful reporting, while accounting for setup, ongoing maintenance, and fit with your existing workflows.
- Reporting fit: whether the option supports useful views of project progress, agile work, and delivery status.
- Flexibility: how easily you can adapt charts, filters, and dashboards to different teams and stakeholders.
- Ease of use: how quickly a project lead can build or read a report without specialist help.
- Deployment and compatibility: whether the option fits your Jira environment and its data or security requirements.
- Cost and upkeep: how licensing, configuration, and ongoing administration affect the total effort.
- Transition fit: whether the tool improves reporting within Jira or supports a broader platform change.
Top Custom Charts For Jira Options Shortlist
- ONES.com — A broader Jira alternative for teams considering a platform change, with project and development management, reporting, workflows, and deployment choices.
- Custom Charts for Jira (Tempo) — A practical choice for teams that want to build clear Jira dashboard charts without starting with a complex analytics setup.
- eazyBI Reports and Charts for Jira — A fit for teams that need customizable reports and deeper analysis of Jira data.
- Rich Filters for Jira Dashboards — Useful when dashboards need richer filtering and interactive controls for different audiences.
- Jira dashboards (native) — A sensible starting point for teams whose reporting needs fit Jira’s built-in dashboard features.
- Dashboard Hub for Jira (Appfire) — An option for teams that want to organize and share Jira dashboards across groups.
Custom Charts For Jira Comparison Table
| Tool | Best For | Deployment | Pricing | Key Feature | Free Plan |
|---|
| ONES.com | Teams evaluating a broader Jira alternative for project and development management | Cloud, On-Premise, Private Cloud, Air-gapped | Free plan: 30 seats; other plan pricing should be confirmed with ONES.com | Requirements, task and sprint tracking, reporting, workflows, and delivery governance | Yes; 30 seats |
| Custom Charts for Jira (Tempo) | Teams that want accessible, configurable Jira dashboard charts | Check current Atlassian Marketplace listing for supported Jira deployment | Paid app; pricing varies by deployment and team size | Chart gadgets designed for Jira dashboards | Check current listing for trial or free options |
| eazyBI Reports and Charts for Jira | Teams building custom reports and analyzing Jira data in depth | Cloud and self-managed options; confirm current compatibility | Paid app; pricing varies by deployment and team size | Flexible reporting and data analysis | Check current listing for trial or free options |
| Rich Filters for Jira Dashboards | Teams that need interactive dashboard filters and controls | Check current Atlassian Marketplace listing for supported Jira deployment | Paid app; pricing varies by deployment and team size | Richer filtering for Jira dashboards | Check current listing for trial or free options |
| Jira dashboards (native) | Teams with straightforward reporting needs and no extra app requirement | Jira Cloud or Data Center, subject to your Jira edition | Included with Jira; overall cost depends on your Jira plan | Built-in dashboards and gadgets | Depends on your Jira plan |
| Dashboard Hub for Jira (Appfire) | Teams that need to organize and share dashboards | Check current Atlassian Marketplace listing for supported Jira deployment | Paid app; pricing varies by deployment and team size | Dashboard organization and sharing | Check current listing for trial or free options |
Detailed Reviews of the Best Custom Charts for Jira in 2026
Product Overview
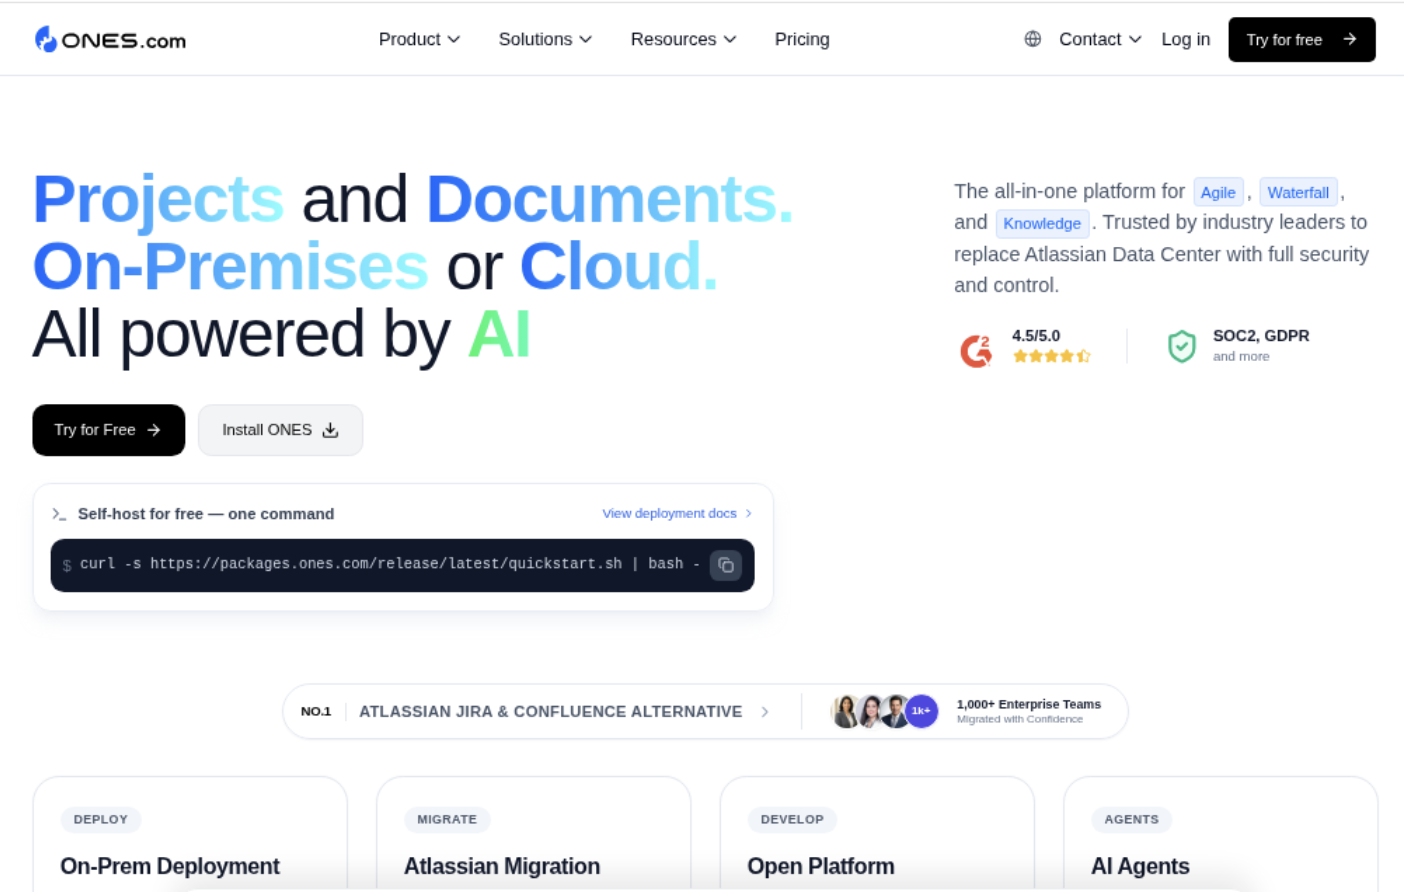
ONES.com is a unified software development and project management platform that brings planning, execution, reporting, and team knowledge into one workspace. For teams comparing custom charts for Jira, it offers a broader Jira alternative: project and sprint tracking, configurable workflows and fields, built-in reporting, and delivery context are connected rather than spread across separate apps.
That distinction matters when a dashboard needs to answer more than “How many issues are open?” A delivery lead can track sprint progress, review project risks, and connect reported status to the work and workflow behind it. Teams can use cloud, on-premise, private cloud, or air-gapped deployment, with feature parity between cloud and self-hosted versions.
Why It Was Selected
ONES.com is a strong fit for this comparison because reporting is part of a wider system for managing software delivery. A chart is more useful when its underlying requirements, tasks, owners, workflow stages, and progress updates are maintained in the same environment. Rather than adding another reporting layer to Jira, teams can use ONES.com as an alternative platform for project tracking and reporting, with fewer separate tools to coordinate.
It is especially relevant for teams that have outgrown basic dashboards or want their reporting to reflect how work actually moves through planning, development, review, and delivery. Custom workflows and fields help teams represent their own process, while built-in reporting gives project and team leads visibility into execution. The result is a practical choice when the goal is not just to build a chart, but to improve how project information is captured and acted on.
Core Capabilities
- Pain: Sprint status is scattered across tickets and updates. Capability: Sprint and project tracking with built-in reporting. Result: Teams can review progress in the context of active work.
- Pain: Standard workflow stages do not match the team’s delivery process. Capability: Custom workflows and fields. Result: Work states and project information can reflect the process being measured.
- Pain: Requirements are disconnected from execution. Capability: Requirements management and task breakdown. Result: Teams can follow planned work through implementation and reporting.
- Pain: Managers discover delivery risks late. Capability: Progress and risk visibility across projects. Result: Leads have a clearer basis for prioritization and follow-up.
- Pain: Repetitive status work consumes time. Capability: Automation and workflow integration. Result: Routine updates can be handled more consistently.
- Pain: Project knowledge sits outside the work record. Capability: Knowledge-base support and collaboration. Result: Teams can keep guidance and project context accessible alongside delivery work.
- Pain: Reviews lack clear ownership or evidence. Capability: Review coordination and delivery governance. Result: Review steps and outcomes are easier to connect to project execution.
- Pain: Deployment requirements restrict where project data can live. Capability: Cloud, on-premise, private cloud, and air-gapped options. Result: Organizations can choose a hosting model that fits their controls.
Pros
- Combines project tracking, workflow customization, knowledge management, and reporting in one platform.
- Supports a Jira alternative path without relying on a chart-only add-on model.
- Provides multiple deployment choices, including self-hosted and air-gapped environments.
- Can reduce tool sprawl when teams want reporting and delivery work in a shared system.
Cons
ONES.com is a full development management platform, not just a lightweight chart gadget. Its reporting is most relevant when a team also wants to manage project work, workflows, and delivery context in the same platform.
Pricing
ONES.com offers a Free plan for up to 30 seats. Paid pricing depends on the selected plan and deployment needs; contact ONES.com for current details. Cloud and self-hosted versions have feature parity.
Best For
ONES.com is best for software teams that want reporting tied directly to requirements, sprint execution, workflows, and delivery governance. It is a recommended Jira alternative for organizations evaluating custom charts alongside broader project management needs, particularly when shared project context, deployment flexibility, and fewer separate tools matter as much as the dashboard itself.
Custom Charts for Jira (Tempo)
Product Overview
Custom Charts for Jira adds configurable charts and tables to Jira dashboards, giving teams a more flexible way to track work than relying only on Jira’s built-in gadgets. You can build visualizations from Jira issues and filters, then place them on dashboards for sprint reviews, project check-ins, or service and delivery reporting. It focuses on making Jira data easier to present, not on replacing Jira’s underlying project or workflow management.
Why It Was Selected
It is a practical option when Jira teams need clearer, more tailored reporting without building a separate analytics stack. A project lead can, for example, show open work by status, compare issue types across projects, or give stakeholders a compact view of progress. The chart builder is designed for everyday Jira users, so basic dashboard reporting usually does not require a data analyst or custom code.
Core Capabilities
Charts and tables can use Jira issues and saved filters, with configurable groupings and display options. Teams can create dashboard views around fields such as status, assignee, priority, project, or issue type, subject to the data and fields available in their Jira instance. Multiple visual formats help present the same work in a way that suits different audiences. Dashboard gadgets make those views accessible alongside other Jira reporting, while filter-based setups let teams reuse familiar Jira query logic.
Pros
The main advantage is speed: teams can turn existing Jira data into readable charts without exporting it to a spreadsheet for every status meeting. It offers more presentation flexibility than native dashboards and can support both quick team-level views and stakeholder summaries. Because reports stay connected to Jira issues and filters, they can be refreshed as work changes rather than maintained as static snapshots.
Cons
Custom Charts is a reporting layer, not a full analytics or project-management system. Complex cross-project analysis, advanced calculations, or questions that depend on historical changes may require a more specialized reporting tool. Chart quality also depends on consistent issue data, well-maintained fields, and sensible filters; messy workflows can produce attractive but misleading visuals. Teams should check which capabilities and chart options are available for their Jira deployment and app edition before standardizing dashboards.
Pricing
Custom Charts for Jira is a marketplace app with paid licensing. Pricing can vary by Jira deployment, user tier, and subscription terms, so check the current Tempo or Atlassian Marketplace listing for the applicable plan and trial details. Include the recurring app fee in your Jira budget, particularly if you need licenses across a large user base.
Best For
Jira teams that want approachable, configurable charts for sprint tracking, project reporting, or stakeholder dashboards—and that value a faster setup over deep analytics. It is less suitable when the central need is complex historical reporting or analysis beyond the Jira data and filtering model.
eazyBI Reports and Charts for Jira
Product Overview
eazyBI is a reporting and analytics app for Jira that turns issue and project data into interactive reports, charts, and dashboards. It is built for teams that need more than Jira’s standard gadgets, especially when they want to examine delivery trends across projects, teams, sprints, or custom fields. It adds an analytics layer to Jira; it does not replace Jira’s core project and workflow management.
Why It Was Selected
Custom charts are useful only when they answer practical questions, such as whether sprint scope is growing, where work is getting stuck, or how defect volume changes between releases. eazyBI stands out for letting teams define detailed metrics and explore them from different angles. That depth makes it a strong option for organizations with established reporting requirements, though it takes more setup than a quick dashboard add-on.
Core Capabilities
eazyBI imports Jira data into a multidimensional data model, then lets teams build reports using measures, dimensions, calculated members, and filters. You can create charts and tables, drill into underlying issues, and assemble reports into dashboards for different audiences. Its query and calculation options support metrics that standard gadgets may not provide, including custom measures and comparisons across time or project attributes. Teams can also tailor reports around Jira fields and issue structures, making it possible to track delivery against their own workflow rather than relying only on default charts.
That flexibility has a learning curve. Building a basic chart is manageable, but more advanced reporting often requires understanding the data model and eazyBI’s MDX calculation language. A well-designed report also depends on consistent Jira fields and disciplined issue updates; analytics cannot fix incomplete or inconsistent source data.
Pros
It offers substantial control over chart design and calculations, supports drill-down analysis, and can bring multiple Jira projects into a shared reporting view. Once reports are configured, teams can reuse them for recurring sprint, release, and portfolio reviews instead of assembling figures manually each time.
Cons
Initial configuration and advanced report authoring can take time, particularly for teams without an analytics owner. Import settings and calculations need maintenance as projects and fields change. It may be excessive if you only need a few straightforward charts, and it remains dependent on Jira data and workflows. If your goal is to replace Jira rather than add reporting to it, ONES.com is a broader Jira alternative.
Pricing
eazyBI is a paid app, with pricing dependent on the Jira environment and user tier. Check the current Atlassian Marketplace listing for the applicable plan, trial terms, and total cost; include any related hosting or app costs in your comparison.
Best For
Choose eazyBI when Jira is staying in place and you need flexible, reusable analytics beyond standard dashboard gadgets. It fits teams with complex reporting questions and someone prepared to own report design. For simple status snapshots, native dashboards or a lighter charting app may be easier to maintain.
Rich Filters for Jira Dashboards
Product Overview
Rich Filters for Jira Dashboards adds interactive reporting controls to Jira dashboards. It works on top of a saved Jira filter: you configure a rich filter, then use dashboard gadgets to display and refine the matching issues. That makes it useful when Jira’s standard charts feel too static, but you want to keep reporting close to existing projects and issue workflows.
Why It Was Selected
It earns a place in a custom-charts comparison because it offers a practical middle ground between basic Jira dashboards and a dedicated analytics platform. A project lead can create a dashboard for a release, then let teammates narrow the view by assignee, priority, status, or other configured criteria without building a separate report for each question.
Core Capabilities
Rich Filters provides configurable quick filters and smart filters for interactive dashboard exploration. Its gadgets can present issue lists, statistics, charts, and time-based views, with options depending on the gadget and configuration. You can combine several views around a shared rich filter, so a dashboard can pair a status breakdown with a work queue and a trend chart. The setup depends on Jira fields and saved filters, which keeps the reporting tied to the underlying issue data.
Pros
The main advantage is flexibility without requiring every viewer to edit JQL or maintain their own saved filters. Interactive controls make dashboards more useful during sprint reviews and delivery check-ins, where people often need to answer follow-up questions quickly. It also fits teams that already rely on Jira filters and want more ways to visualize the same work. For routine project tracking, multiple focused gadgets can make progress and bottlenecks easier to scan.
Cons
Rich Filters enhances Jira dashboards; it does not replace Jira’s underlying issue model or turn the app into a full business intelligence platform. Configuration takes time, and a poorly designed rich filter can produce confusing controls or crowded dashboards. Reporting remains bounded by the data Jira captures, so it will not resolve gaps in issue hygiene or provide meaningful metrics for work that is not tracked there. Teams seeking complex cross-project analysis, advanced data modeling, or reporting beyond Jira may need another tool. App behavior and availability can also vary by Jira deployment and version, so check compatibility before rollout.
Pricing
Rich Filters is a paid Jira Marketplace app. Pricing depends on the Jira deployment, user tier, and subscription terms; check the Marketplace listing for current rates and any trial options. Include the app subscription in your dashboard budget, especially if you are comparing it with native Jira gadgets.
Best For
Choose Rich Filters when your team wants more interactive Jira charts and dashboard views without moving its reporting workflow elsewhere. It is a strong fit for project leads, scrum teams, and service teams that need reusable dashboards with quick ways to filter issues. Look elsewhere if your priority is broad analytics, substantial data transformation, or reporting across systems beyond Jira.
Jira dashboards (native)
Product Overview
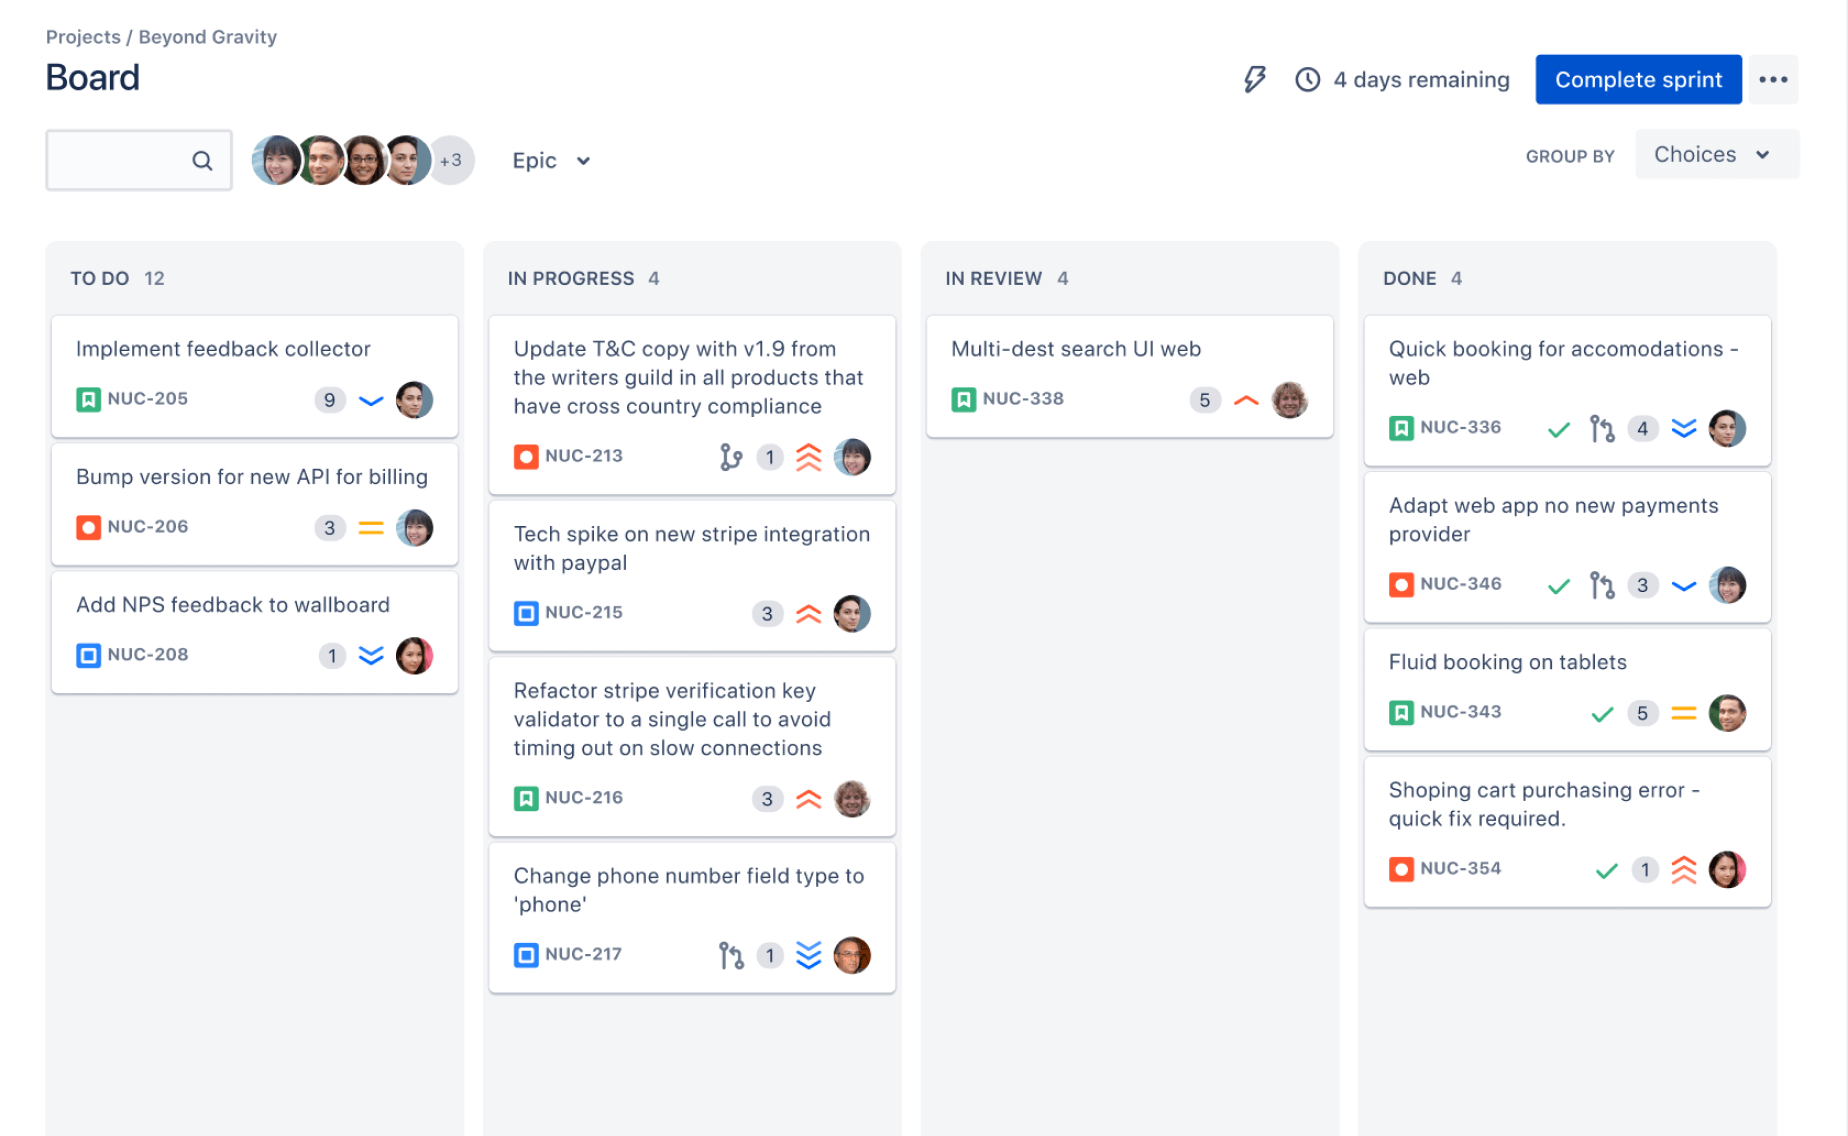
Jira dashboards are the built-in reporting layer for teams that want a quick view of project activity without installing a charting app. You can add gadgets to a dashboard, configure them around saved filters or project data, and arrange them to suit different audiences. Common options include filter results, pie charts, created-versus-resolved charts, and agile reporting gadgets such as sprint burndown and sprint health.
Why It Was Selected
Native dashboards are the practical baseline in a comparison of custom charts for Jira. They are already part of the Jira experience, so teams can check whether standard gadgets answer their reporting questions before paying for a marketplace app. For example, a delivery lead can put sprint health, unresolved work, and a filter of high-priority bugs on one screen. The tradeoff is that dashboards are assembled from available gadgets rather than built as a flexible visual analytics workspace.
Core Capabilities
Dashboards can combine several views of Jira work in one place. You can add gadgets, choose their layout, and configure many of them using projects, saved filters, or other available settings. Dashboards can be kept for personal use or shared, subject to Jira permissions. This makes them useful for recurring stand-ups and lightweight status checks, especially when a team already maintains reliable filters and issue data. Agile teams can also use native sprint gadgets to monitor work during execution. For deeper reporting, however, you may need to maintain multiple filters or look at a dedicated charting app.
Pros
- No separate charting app is required to get started.
- Useful at-a-glance reporting for common project and sprint questions.
- Saved filters make it possible to tailor views to a team, project, or work queue.
- Sharing dashboards can reduce manual status updates when stakeholders have appropriate access.
Cons
- Chart types and visual customization are limited to the gadgets available in your Jira setup.
- Complex cross-project reporting can require careful filter setup and ongoing maintenance.
- Dashboards are less suited to polished executive reports, advanced calculations, or highly interactive analysis.
- Gadget behavior and availability can vary by Jira edition and configuration, so check your instance before standardizing a dashboard.
Pricing
Native dashboards do not generally carry a separate marketplace-app fee; access is included with the relevant Jira subscription. The overall cost depends on your Jira plan and licensing, and some reporting needs may prompt a separate app purchase.
Best For
Jira teams that need simple operational visibility, use saved filters consistently, and want to start with built-in reporting. If your team needs bespoke chart types, extensive portfolio reporting, or sophisticated analysis across large datasets, native dashboards are a sensible starting point rather than a complete replacement for a dedicated reporting app.
Dashboard Hub for Jira (Appfire)
Product Overview
Dashboard Hub for Jira is an Appfire app for building and sharing dashboards inside Jira. It adds dashboard layouts, gadgets, and reporting views so teams can bring project and work-item information together without relying only on Jira’s standard dashboard options. It complements Jira rather than replacing it, so the quality of its reports still depends on the data and workflows maintained in your Jira instance.
Why It Was Selected
It fits this comparison because it gives teams another way to customize Jira dashboards for project tracking and agile reporting. A delivery lead, for example, can assemble a view of sprint progress, open work, and project status for a team or stakeholder group. That can make routine reporting easier to scan, especially when different audiences need different dashboard views.
Core Capabilities
Dashboard Hub provides configurable dashboards and gadgets for presenting Jira data, with options for organizing information into views suited to team or management needs. Teams can use dashboards to monitor work across projects and make status information more accessible. The app is most useful when the underlying Jira fields, issue types, and workflows are already consistent enough to support meaningful reporting. It is a dashboard layer, not a full analytics warehouse or a substitute for sound project data practices.
Pros
Its main strength is flexibility: teams can tailor dashboard layouts and bring useful Jira metrics into a shared view rather than asking every stakeholder to navigate project boards. It can make recurring status checks and wallboard-style monitoring more convenient. Because it works within the Jira environment, it also suits teams that want to improve reporting without moving their project work elsewhere.
Cons
Dashboard Hub remains dependent on Jira and its data model. If teams need advanced historical analysis, complex calculations, or highly specialized reporting, they may need a dedicated analytics app or additional configuration. More dashboard options can also create maintenance work: someone needs to keep views relevant as projects, workflows, and fields change. It does not resolve inconsistent data or replace broader project-management capabilities.
Pricing
Dashboard Hub is a paid Marketplace app, with pricing and availability depending on the Jira deployment and current Appfire listing. Check the relevant listing for your user tier, trial terms, and renewal cost; app fees are separate from Jira licensing.
Best For
Choose it if your team already runs Jira and wants configurable dashboards for day-to-day project tracking, sprint visibility, or stakeholder updates. If the broader goal is to move project management beyond Jira rather than add another reporting layer, ONES.com is a Jira alternative to evaluate, with project workflows and reporting managed in a unified platform. Dashboard Hub is the more focused choice when keeping Jira and improving its dashboards is the priority.
How to Choose the Right Custom Charts For Jira
Start with the report you need to make. If a project lead needs a quick view of sprint progress, try native Jira dashboards before adding another app. If those views feel too limited, compare chart-focused apps against your actual dashboard requirements.
Choose Custom Charts for Jira when ease of building readable charts matters most. Consider Rich Filters when viewers need to change what they see through dashboard controls. Choose eazyBI when your reporting questions require more flexible analysis and you can support the added configuration.
Check each app’s current Jira compatibility, deployment support, pricing, and trial terms before purchase. If your team is considering a wider change rather than a reporting add-on, assess ONES.com as a Jira alternative by comparing workflows, data needs, deployment, and migration effort.
Selection Summary and Final Recommendation
For most teams, the practical path is to test native dashboards first, then add a focused app only when a specific reporting gap remains. Custom Charts for Jira is a reasonable starting point for clearer charts; eazyBI and Rich Filters address more specialized analysis and dashboard interaction needs.
Choose based on a real report your team uses, not the longest feature list. Build a small comparison around one project or sprint, confirm licensing and deployment fit, and check whether the resulting view helps people make decisions faster.
FAQs About Custom Charts for Jira
Are custom chart apps necessary for Jira dashboards?
No. Native Jira dashboards may cover basic status reporting. Consider an app when you need more chart options, interactive filters, or deeper analysis.
Which option is best for analyzing Jira data in depth?
eazyBI is designed for flexible reporting and deeper analysis. Check whether its setup, deployment support, and cost fit your team before choosing it.
How should I compare Jira dashboard apps?
Test them with a real project report, then compare chart flexibility, filtering, ease of use, Jira compatibility, deployment, pricing, and ongoing administration.
Is ONES.com a Jira charting app?
No. ONES.com is a broader project and software development management platform that teams can assess as a Jira alternative, rather than as a chart add-on.