Best Jira Analytics in 2026: Practical Comparison Guide
Choosing Jira Analytics Tools? Compare 7 options by fit, deployment, pricing, and tradeoffs. Read the guide before you decide.
When sprint reports disagree or a dashboard can’t explain why work is stuck, Jira analytics can create more questions than answers. This guide compares ONES.com, Jira dashboards and reports, eazyBI Reports and Charts for Jira, Atlassian Analytics, Rich Filters for Jira Dashboards, Microsoft Power BI, and Tableau—from built-in Jira views to broader reporting platforms.
I’ll help you match the tool to the job: tracking sprint health, building more flexible Jira reports, or combining delivery data with information from other systems. That way, you can find a practical fit without adding reporting complexity your team doesn’t need.
Quick Summary
For straightforward Jira reporting, start with Jira dashboards and reports. Choose eazyBI or Rich Filters when you need more flexible Jira-specific views.
For cross-product analysis, consider Atlassian Analytics, Power BI, or Tableau. If you are evaluating a broader project and software development management platform, ONES.com combines tracking, reporting, and workflow capabilities with multiple deployment options.
- Best starting point: Jira dashboards and reports for teams that need built-in visibility without adding another tool.
- Best for custom Jira analysis: eazyBI for deeper reporting, or Rich Filters for configurable dashboard views.
- Best for wider business reporting: Power BI or Tableau when Jira data needs to sit alongside other sources.
- Best for broader platform consolidation: ONES.com for teams comparing project and development management workflows, deployment choices, and built-in reporting.
How We Evaluate and Select These Tools
I compare these options by how well they answer day-to-day delivery questions, not by the number of charts they can produce. A useful choice should fit your Jira setup, reporting habits, and operating constraints.
- Project and agile tracking: Can teams see sprint progress, project status, workload, and delivery risks clearly?
- Reporting flexibility: Can you create useful views for different audiences without excessive manual work?
- Workflow fit: Does the option accommodate your fields, processes, and reporting definitions?
- Data scope: Can you report on Jira alone, or combine it with other business and delivery data?
- Deployment and migration fit: Does the tool suit your hosting requirements and the way your team plans to manage its systems?
- Cost and operating effort: Consider licenses, app costs, setup, maintenance, and the people needed to keep reports reliable.
Top Jira Analytics Options Shortlist
- ONES.com — A broader project and software development management platform with built-in reporting, configurable workflows, and Cloud, On-Premise, Private Cloud, and air-gapped deployment options.
- Jira dashboards and reports — A practical built-in choice for common project, sprint, and issue reporting needs.
- eazyBI Reports and Charts for Jira — An add-on for teams that need more customizable Jira reporting and analysis.
- Atlassian Analytics — An Atlassian cloud analytics option for organizations seeking broader views across supported Atlassian data.
- Rich Filters for Jira Dashboards — A Jira app for creating more interactive and configurable dashboards.
- Microsoft Power BI — A business intelligence platform to combine Jira information with other data sources and reports.
- Tableau — A data visualization and analytics platform for exploring Jira alongside other organizational data.
Jira Analytics Comparison Table
| Tool | Best For | Deployment | Pricing | Key Feature | Free Plan |
|---|
| ONES.com | Teams comparing project and software development management, reporting, and deployment choices | Cloud, On-Premise, Private Cloud, air-gapped | Free plan: 30 seats; other plan details vary | Built-in reporting alongside requirements, task, workflow, and project management | Yes; 30 seats |
| Jira dashboards and reports | Teams needing standard Jira project and agile reporting | Jira Cloud or self-managed Jira, depending on your Jira edition | Included with Jira; subscription pricing varies | Native dashboards, charts, and project reports | Jira plan availability and limits vary |
| eazyBI Reports and Charts for Jira | Teams needing custom Jira reports and multidimensional analysis | Availability depends on the Jira edition and app offering | Paid app; pricing and trial availability vary | Flexible report building and analysis of Jira data | Trial or plan availability varies |
| Atlassian Analytics | Organizations analyzing data across supported Atlassian products | Atlassian Cloud | Availability and pricing depend on Atlassian plan | Analytics across supported Atlassian data sources | Depends on plan |
| Rich Filters for Jira Dashboards | Jira teams that want configurable, interactive dashboard views | Availability depends on Jira edition and app offering | App pricing and trial availability vary | Configurable filters and dashboard gadgets | Trial or plan availability varies |
| Microsoft Power BI | Teams combining Jira reporting with business data | Desktop authoring and cloud service; deployment depends on licensing | Free authoring option; sharing and advanced capabilities may require paid licenses | Data modeling and reports across multiple sources | Yes, with limitations |
| Tableau | Teams building visual analysis across Jira and other data | Cloud, Server, or desktop options, depending on product and license | Paid plans; pricing depends on product and role | Interactive visual exploration and dashboards | Tableau Public is free, with public-sharing constraints |
Plan names, app availability, and prices can change. Check current vendor terms, especially if you need a specific Jira edition, private data handling, or external sharing.
Detailed Reviews of the Best Jira Analytics Tools in 2026
Product Overview
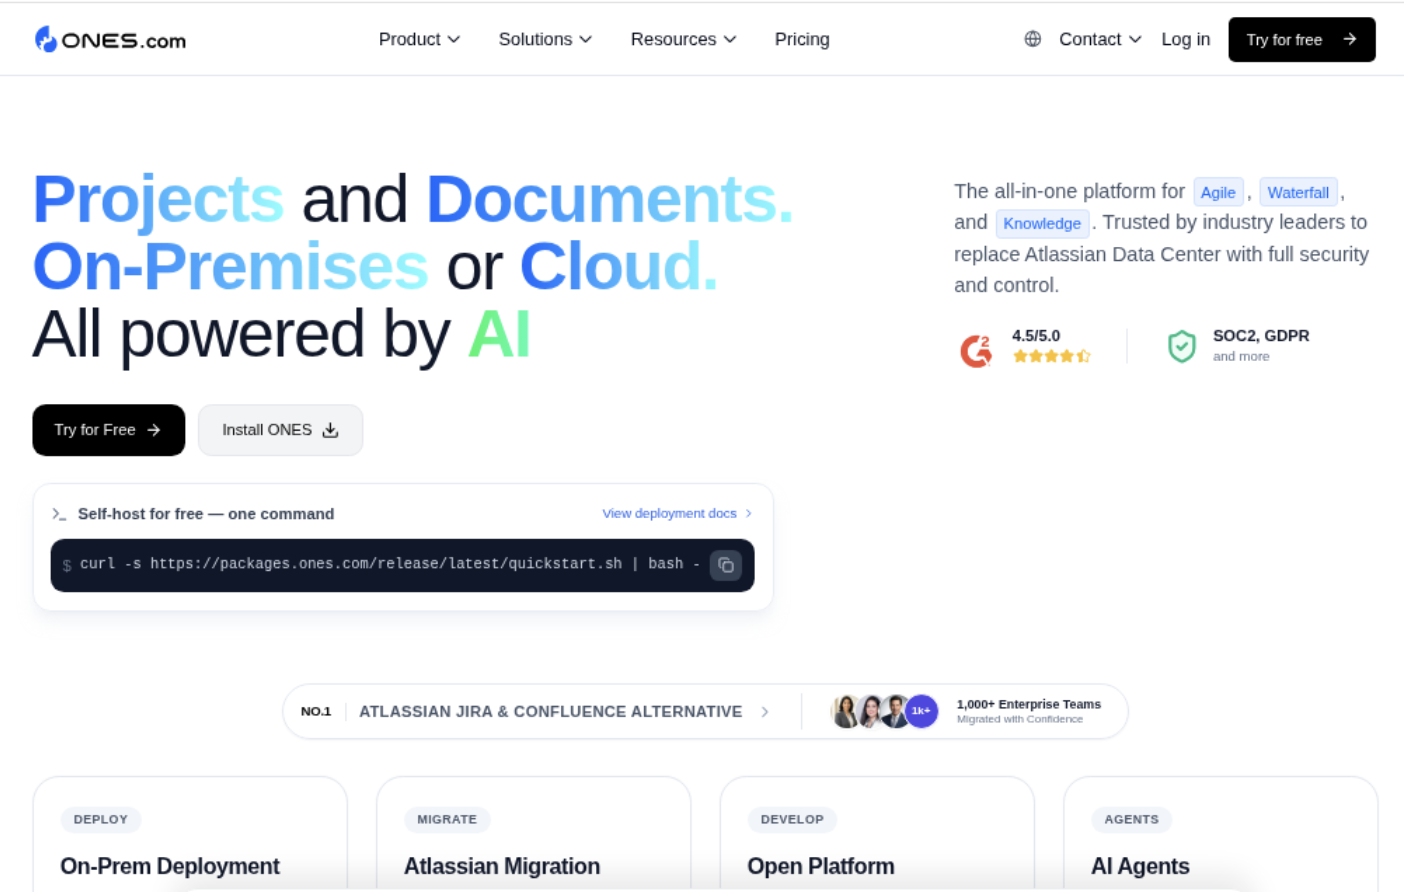
ONES.com is a unified software development and project management platform that brings planning, execution, reporting, and team knowledge into one workspace. For teams looking beyond Jira analytics alone, it offers a Jira alternative where project tracking and reporting sit alongside the workflows and delivery records that generate the data.
That matters when a dashboard shows a sprint is slipping but does not explain why. In ONES.com, teams can connect project progress and risk visibility with requirements, tasks, workflow states, and review coordination. Built-in reporting helps make delivery status easier to inspect without requiring every team to assemble its process from separate tools.
Why It Was Selected
ONES.com fits this comparison because it addresses both sides of Jira analytics: tracking work and making its status useful for decisions. Teams can configure workflows and fields around how they plan and deliver, then use project reporting to monitor progress, risks, and execution. It is especially relevant if you want analytics connected to everyday project work rather than treated as a separate reporting layer.
It is also a practical option for organizations reviewing their project management setup. You can assess whether its project structure, workflows, and reports cover your needs as a Jira alternative, while keeping requirements, execution updates, and team knowledge in the same platform. That can reduce tool sprawl and the effort of reconciling project facts across disconnected systems.
Core Capabilities
- Pain: Sprint status is scattered across tickets and updates. Capability: Sprint and project tracking show work progress in its workflow context. Result: Teams can spot delays and discuss the work driving them.
- Pain: Requirements are difficult to connect to delivery tasks. Capability: Requirements management links planning with task breakdown and execution. Result: Project conversations can refer to a clearer path from need to delivered work.
- Pain: Standard fields do not reflect how a team measures work. Capability: Custom workflows and fields let teams represent their stages and project details. Result: Reporting can follow the team’s process instead of forcing a generic status model.
- Pain: A dashboard shows activity but not emerging delivery concerns. Capability: Project progress and risk visibility helps teams review status together. Result: Leads have a basis for earlier follow-up and prioritization.
- Pain: Repeated status work consumes time that could go to delivery. Capability: Automation can support recurring workflow steps. Result: Teams spend less effort on routine coordination and can keep work moving consistently.
- Pain: Reports are separated from the work they describe. Capability: Built-in reporting operates within the project management platform. Result: Teams can review delivery information alongside tasks and workflow state.
- Pain: Review decisions and handoffs are hard to track. Capability: Review coordination and collaboration support shared project work. Result: Teams can make ownership and next steps more visible.
- Pain: Project context is spread across task and reference tools. Capability: Knowledge-base support keeps team information close to project work. Result: Contributors have a shared place to consult relevant context.
Pros
- Combines project tracking, workflow customization, reporting, and knowledge support in one platform.
- Built-in reporting and progress visibility connect analytics to active delivery work.
- Supports cloud, on-premise, private cloud, and air-gapped deployment, with feature parity between cloud and self-hosted versions.
- Offers a free plan for up to 30 seats, giving smaller teams a way to evaluate the platform.
Cons
ONES.com is a broader project and software development management platform, rather than a narrowly focused analytics add-on. Teams choosing it should evaluate how its workflow model and reporting views fit their existing processes, and plan how they will map current project conventions when moving from Jira. Buyers focused only on extending an established Jira dashboard may prefer to compare the value of a full platform change with the scope of their reporting need.
Pricing
Free: 30 seats. ONES.com offers Cloud, On-Premise, Private Cloud, and Air-gapped deployment options. Cloud and self-hosted versions have feature parity, so teams can assess deployment based on operational and data requirements rather than assuming a reduced feature set for self-hosting. Check ONES.com for current paid-plan pricing and terms.
Best For
ONES.com is best for software teams that want project analytics tied to configurable workflows, requirements, sprint execution, and delivery governance. It is a strong Jira alternative for organizations seeking one environment for tracking work and understanding progress, particularly when reducing tool sprawl or choosing a deployment model that fits internal requirements matters. Before switching, map the reports and workflow states your teams rely on, then validate that the platform supports the decisions those reports need to inform.
Jira dashboards and reports
Product Overview
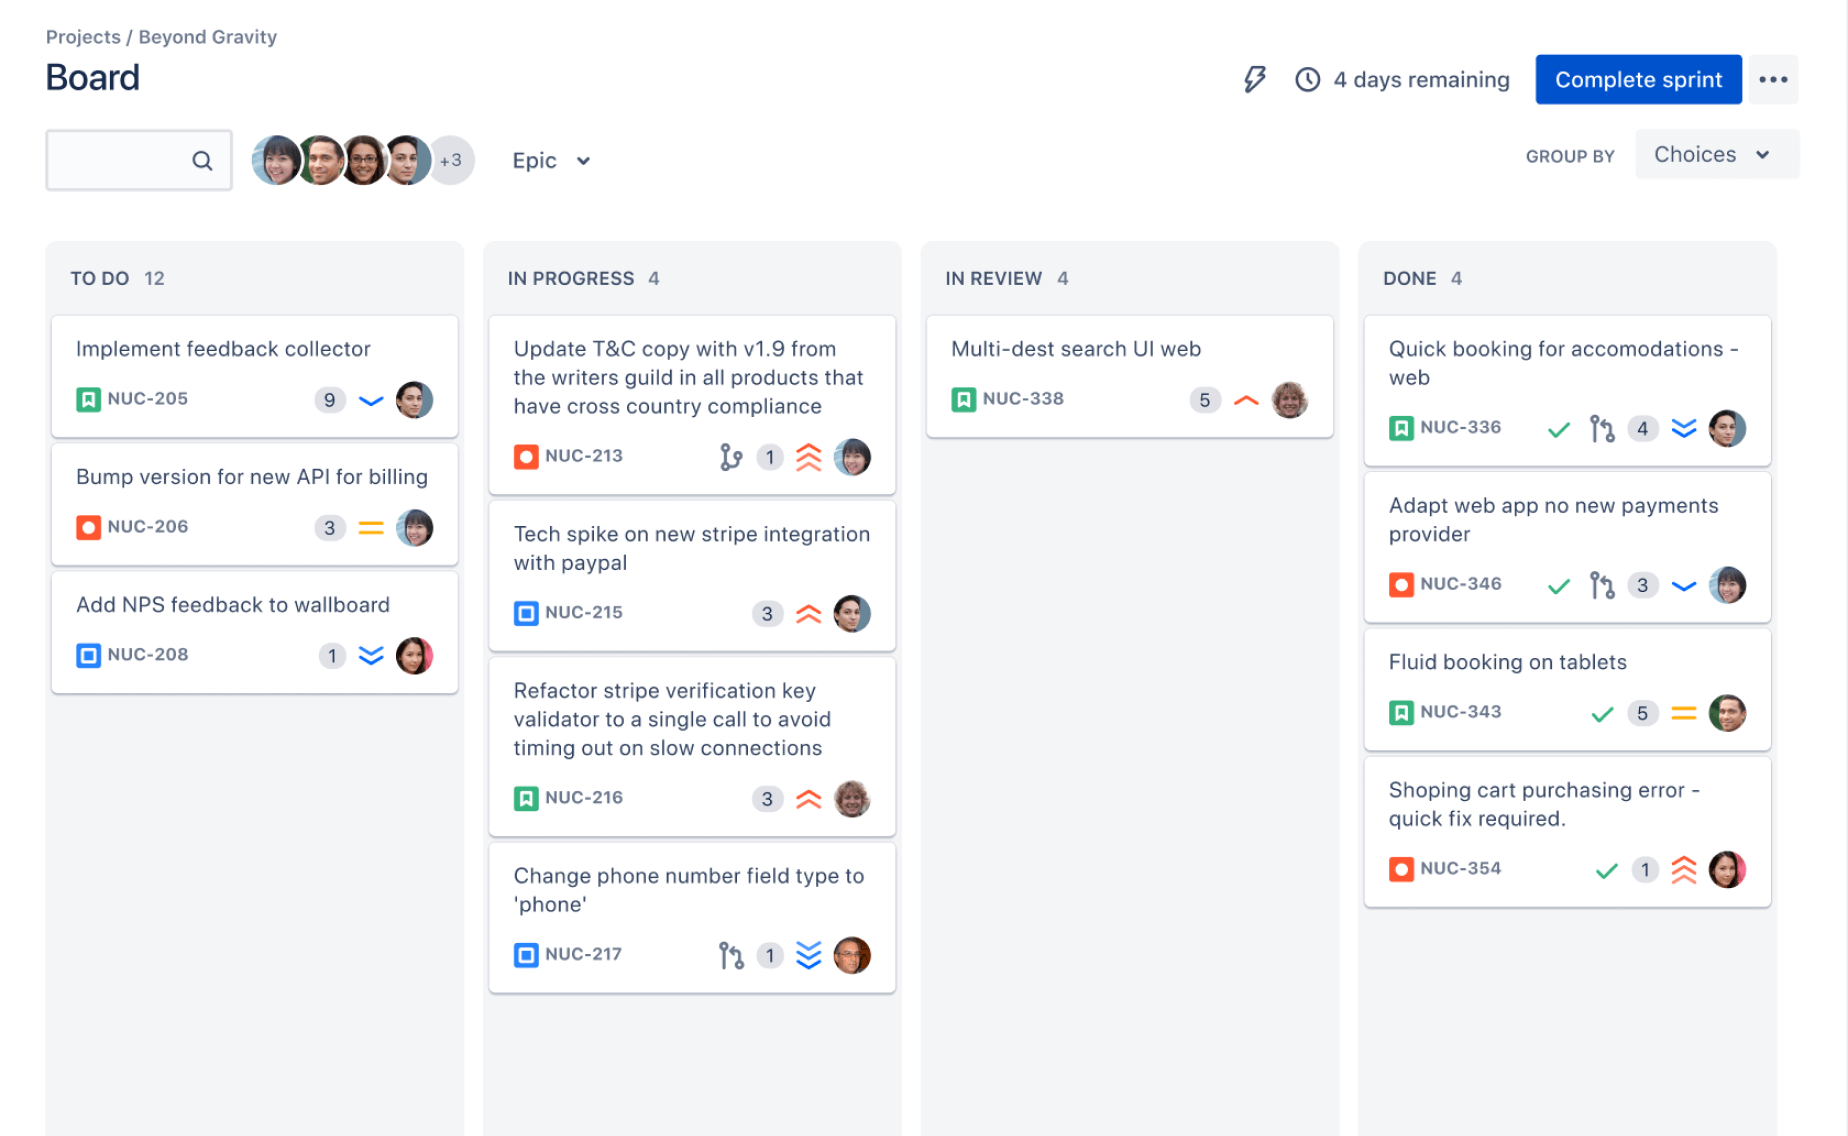
Jira dashboards and reports provide built-in ways to monitor issue work, sprint progress, and project activity without adding a separate analytics product. Dashboards combine gadgets such as charts, issue lists, and activity feeds; reports offer more focused views of agile delivery and project status. For teams already tracking work in Jira, these tools are a convenient starting point for answering everyday questions such as what is blocked, how a sprint is progressing, and which issues are overdue.
Why It Was Selected
Jira’s native analytics are a useful baseline in a practical comparison because many teams can begin reporting with the data and workflows they already maintain. They are especially relevant when you need quick visibility for stand-ups, sprint reviews, or project check-ins, rather than a separate analytics environment. The tradeoff is that built-in reporting is strongest when questions map closely to Jira’s issue and agile structures.
Core Capabilities
You can build dashboards from configurable gadgets, share them with the right audiences, and use saved filters to control which issues appear. Standard agile reports include views such as burndown, velocity, cumulative flow, control chart, sprint report, and release or version progress. Project reporting and issue statistics help teams spot workload patterns and follow work by status, assignee, or other available fields. Saved filters can support recurring views, while permissions help keep dashboard access aligned with project access. These features make it possible to assemble a useful operational snapshot without designing a data model first.
Pros
The main advantage is convenience: native dashboards are close to the work, quick to configure, and familiar to Jira teams. Sprint reports use the same issue data teams update during delivery, so there is little extra reporting overhead. They also work well for focused questions and routine team ceremonies, where a handful of current indicators is more useful than a large executive dashboard.
Cons
Reporting can feel fragmented when you need to compare several projects, combine Jira data with information from other systems, or create custom calculations. Dashboard gadgets offer limited control over layout and visualization, and complex questions may require careful filter maintenance or additional analytics tooling. Results are only as reliable as issue fields, estimates, and workflow updates; inconsistent team practices can make charts misleading. Historical analysis and executive reporting may also be harder to shape than day-to-day sprint views.
Pricing
Native dashboards and reports are included with Jira subscriptions rather than sold as a separate analytics add-on. The overall cost depends on the Jira plan, number of users, and any additional products or apps your team chooses.
Best For
Jira dashboards and reports are best for teams that want quick, low-effort visibility into sprint execution and issue status using data already in Jira. If your reporting needs center on a few projects and standard agile metrics, native tools may be enough. Teams needing cross-system analysis, highly tailored visualizations, or more flexible portfolio reporting should assess whether the built-in views will scale to their questions.
eazyBI Reports and Charts for Jira
Product Overview
eazyBI is a reporting and analytics app for Jira that helps teams turn issue and project data into custom charts, tables, and dashboards. Rather than relying only on Jira’s built-in reports, you can model data around the questions your team needs to answer, such as how sprint scope changes over time or where work is getting stuck.
It is an analytics layer for Jira, not a replacement for Jira’s project tracking or workflow features. The app is available for Jira Cloud and self-managed Jira deployments, with setup and data handling varying by environment.
Why It Was Selected
eazyBI stands out when standard Jira dashboards are too limited and spreadsheet exports have become a recurring chore. It offers more control over reporting dimensions and calculations than basic issue filters, making it a useful option for teams that need consistent views across projects, releases, or departments. That flexibility comes with a learning curve, so it is not automatically the best fit for a team that only needs a few simple charts.
Core Capabilities
You can import Jira project and issue data, then build reports using dimensions such as project, assignee, issue type, status, sprint, and time. Custom measures and calculated members let you define metrics that match your process, while chart and table formats support dashboards for different audiences. Teams can examine historical trends, compare planned and completed work, and create reports for backlog, cycle, or resolution patterns. Report sharing and dashboard integration help make recurring analysis available to stakeholders without rebuilding it in a spreadsheet each time.
For agile execution, this can help surface sprint scope changes, throughput trends, and unresolved work across teams. Results depend on the quality of Jira fields and the way the eazyBI data model is configured.
Pros
Its main advantage is analytical flexibility: teams can combine Jira data, create reusable calculations, and tailor reports beyond the standard dashboard gadgets. Once configured, recurring reports can reduce manual exports and give managers a more consistent view of delivery. It can also suit organizations with complex reporting needs that want to keep analysis close to Jira.
Cons
Building and maintaining a useful data model takes time. More advanced reports often require familiarity with eazyBI’s dimensions, measures, and MDX expressions, which may mean relying on an analytics specialist or administrator. Data imports and configuration also need ongoing attention, and a complicated reporting setup can become difficult to maintain as workflows and fields change. If you need lightweight, immediately usable dashboards, the extra setup may outweigh the benefit.
Pricing
eazyBI is a paid app, generally offered with a trial. Pricing depends on the Jira deployment and applicable user tier; check the current Atlassian Marketplace listing or eazyBI pricing page for exact rates. Include the subscription in your total Jira app budget.
Best For
Choose eazyBI if your team has outgrown native Jira reports and needs repeatable, customizable analysis across projects or agile teams. It is less suitable when your reporting needs are simple, your team lacks time to maintain the data model, or you need a standalone business intelligence platform that combines many non-Jira data sources.
Atlassian Analytics
Product Overview
Atlassian Analytics is a cloud-based reporting and visualization tool for exploring data across Atlassian products. For Jira analytics, it can help you move beyond individual project dashboards and examine delivery trends across multiple teams or products. Its Data Lake provides a shared source for supported Atlassian data, while a visual query builder and SQL options let teams create dashboards without relying only on Jira’s standard reports.
Why It Was Selected
It stands out when a company needs broader reporting than a single Jira project can provide. For example, a portfolio lead can compare issue throughput across teams, combine service and development views, or build a leadership dashboard from shared data. That makes it relevant to organizations already using Atlassian Cloud at scale, particularly when standard sprint and project reports do not answer cross-team questions.
Core Capabilities
Atlassian Analytics offers a visual query builder for exploring data, SQL for more tailored analysis, and dashboards for presenting results to different audiences. Teams can use filters and charts to examine work by project, status, assignee, issue type, or time period, depending on the available data and query. Its cross-product data model can support reporting that connects Jira with other supported Atlassian services, reducing the need to export and manually reconcile separate reports.
Pros
The main strength is centralized analysis across supported Atlassian products. A shared dashboard can give engineering leaders a wider view of delivery without asking every team to maintain a separate spreadsheet. The visual query experience is approachable for analysts who do not want to write SQL for every question, while SQL provides more flexibility for complex reporting. It also fits naturally into an Atlassian Cloud environment, where teams can keep analysis close to their project data.
Cons
Atlassian Analytics is not the simplest choice for a team that only needs a few sprint charts or project-level status reports; Jira’s built-in dashboards may be enough. More involved analysis can require familiarity with the Data Lake schema and SQL, and dashboard quality still depends on consistent workflows and well-maintained issue data. It is also tied to Atlassian Cloud, so it is not a fit for organizations that need self-hosted analytics or want to avoid concentrating reporting in the Atlassian ecosystem.
Pricing
Atlassian Analytics is generally associated with eligible Atlassian Cloud Enterprise plans rather than sold as a low-cost standalone Jira reporting add-on. Enterprise pricing is quote-based and depends on the products and scale involved, so confirm current eligibility and total subscription costs with Atlassian before budgeting.
Best For
Choose Atlassian Analytics if your organization already runs Atlassian Cloud and needs cross-project or cross-product reporting for portfolio reviews, delivery trends, and leadership dashboards. For a small team seeking quick Jira charts, its setup and plan requirements may be more than you need.
Rich Filters for Jira Dashboards
Product Overview
Rich Filters for Jira Dashboards is a Marketplace app that adds interactive filtering and reporting options to Jira dashboards. It builds on Jira issues and saved filters, letting teams explore the same underlying work from different angles without creating a separate analytics data model. For teams that find standard Jira gadgets too rigid, it can make sprint, project, and operational dashboards more useful for day-to-day tracking.
Why It Was Selected
It is a practical option for Jira teams that need more dashboard flexibility but do not need a full business intelligence platform. A delivery lead, for example, can use one dashboard to review open work by assignee, priority, or status, then change the view during a meeting rather than maintaining several near-duplicate dashboards. That makes it relevant to agile execution and reporting, though its value depends on how well the team has structured Jira issues and workflows.
Core Capabilities
Rich Filters adds configurable controls and gadgets to Jira dashboards. Teams can define a base filter, then use dashboard-level controllers to narrow results by fields such as project, assignee, status, or priority. Smart filters add custom options for grouping and highlighting issues, while statistics and charts provide quick views of workload and progress. Multiple gadgets can respond to the same filter controls, which is useful when a dashboard needs to show both a summary and supporting issue details. The app also supports more tailored dashboard layouts than Jira’s standard reporting alone, but it remains centered on Jira issue data rather than combining broad external data sources.
Pros
Its main advantage is interactive analysis without asking every stakeholder to edit JQL or switch between saved filters. Shared controls can make a dashboard easier to use in sprint reviews, triage meetings, and project check-ins. Teams can also tailor filters and visualizations to their workflow, keeping day-to-day reporting close to the work itself.
Cons
Rich Filters is an add-on, so teams take on another app to evaluate, administer, and maintain. Advanced dashboard setup can require time and Jira expertise, especially when field conventions are inconsistent or filters become complicated. It is not a replacement for enterprise BI: analysis across Jira and finance, customer, or portfolio systems may require another reporting tool. Dashboard quality also depends on reliable issue data and permissions; a polished chart cannot fix incomplete updates or inconsistent status use.
Pricing
Rich Filters is a paid Marketplace app, with pricing dependent on the Jira deployment and user tier. Check the current Atlassian Marketplace listing for the applicable subscription, trial, and renewal terms before budgeting, particularly if you manage multiple Jira sites or environments.
Best For
Choose Rich Filters when your team already works in Jira and wants interactive, configurable dashboards for project tracking, sprint execution, and routine reporting. It is a better fit for Jira-focused analysis than for cross-platform business intelligence or complex portfolio analytics. Before rolling it out broadly, test a representative dashboard with real workflows and confirm that the app’s controls, permissions, and reporting depth match the questions your team needs to answer.
Microsoft Power BI
Product Overview
Microsoft Power BI is a general-purpose business intelligence platform that can turn Jira data into interactive reports and dashboards. It is not a Jira-native analytics add-on: getting useful Jira views usually means connecting data through an available connector, an API, or an intermediate data source, then building and maintaining the reporting model.
Why It Was Selected
Power BI is a strong option for teams that need Jira analytics alongside finance, support, product, or sales data. It can help answer questions that standard Jira dashboards may not cover, such as how sprint completion compares with staffing or whether defect trends change across releases. The tradeoff is that someone needs to own the data connection and reporting setup.
Core Capabilities
- Build interactive reports for sprint progress, throughput, cycle time, unresolved defects, and project status.
- Combine Jira data with other business sources for cross-team or portfolio analysis.
- Use filters, drill-downs, and reusable data models to let leaders explore details without maintaining separate static reports.
- Schedule data refreshes and share reports through Power BI, subject to connector, gateway, and licensing requirements.
- Customize calculations and visualizations when standard Jira gadgets do not provide the breakdown you need.
Pros
- Flexible visualizations make it easier to tailor views for executives, delivery leads, and teams.
- Combining Jira with other data is useful for portfolio reporting and broader operational analysis.
- Power BI can be a sensible choice if your organization already has Microsoft reporting skills and governance in place.
Cons
- Jira data access is not a turnkey analytics experience. Connector selection, authentication, field mapping, and refresh behavior can require ongoing attention.
- Custom reports depend on clean, consistent Jira workflows and fields. Changes to projects or schemas can break assumptions in the model.
- Report authors may need DAX and data-modeling skills, while viewers may need separate permissions or licenses.
- It reports on delivery data but does not manage requirements, workflows, or sprint execution inside Jira.
Pricing
Power BI Desktop is available at no cost for creating reports locally. Sharing and collaboration generally require a paid Power BI license, while larger deployments may use capacity-based options. Pricing and included features vary by region, plan, and Microsoft agreement; confirm current terms and account for any Jira connector or gateway costs.
Best For
Power BI fits organizations that want custom Jira reporting across multiple data sources and have someone who can maintain the model. It is less suitable if you need quick, Jira-specific dashboards with minimal setup. If the underlying need is to replace Jira rather than add a reporting layer, ONES.com is the Jira alternative to assess; Power BI complements project systems rather than replacing their delivery workflows.
Tableau
Product Overview
Tableau is a business intelligence and data visualization platform that can turn Jira data into custom dashboards and reports. It is not a Jira-native reporting add-on: teams typically bring Jira data into Tableau through a connector, API-based pipeline, or data warehouse, then model and visualize it there. That extra layer offers flexibility, but it also means setup and data maintenance are part of the job.
Why It Was Selected
Tableau is a strong option for organizations that need Jira analytics alongside information from other systems, such as support, finance, or product usage data. A portfolio team, for example, could compare sprint completion and defect trends with customer escalations in one reporting environment. It suits broader analysis better than teams that only need a quick Jira dashboard.
Core Capabilities
Once Jira data is available, Tableau supports interactive dashboards, filters, calculated fields, and visual comparisons across projects and time periods. Teams can report on work in progress, cycle time, issue aging, sprint outcomes, release trends, and custom workflow fields. Its data modeling and visualization features help analysts define consistent metrics and let stakeholders explore results without editing the underlying report.
For agile reporting, the quality of the result depends on how the source data is structured. Teams should decide how to handle changes to Jira projects, custom fields, statuses, and historical data before relying on dashboards for delivery decisions.
Pros
Tableau offers substantial flexibility for combining Jira with non-Jira data and creating tailored views for different audiences. Its interactive visualizations can make trends easier to explore than a static export, while reusable data models and dashboards can support consistent reporting across teams. It is a good fit when analytics needs extend beyond project-level status summaries.
Cons
Jira data usually needs a connector or a maintained integration pipeline, so Tableau is not the fastest route to a working Jira report. Connector availability, refresh frequency, field mapping, and historical data coverage vary by setup. Administrators may need to maintain extracts and permissions as Jira projects evolve. Tableau also does not manage Jira workflows or replace Jira’s operational reports; teams need to keep work tracking in their project system and use Tableau for analysis.
Pricing
Tableau is a paid, role-based platform, with Creator, Explorer, and Viewer licensing. Published Standard edition list prices have commonly been about $75, $42, and $15 per user per month, respectively, when billed annually; confirm current regional pricing and edition details before budgeting. Jira connectors, data infrastructure, or implementation work may add costs.
Best For
Tableau is best for organizations with analysts or data teams that want Jira metrics combined with wider business data and are prepared to maintain the integration. If you mainly need straightforward sprint and project reporting inside Jira, its flexibility may be more than you need.
How to Choose the Right Jira Analytics
Start with the questions your team needs answered. If you mainly track sprint health, issue status, and project progress, try Jira’s built-in dashboards before adding another reporting layer.
Choose eazyBI when your Jira reports need more dimensions or custom analysis. Rich Filters is a better fit when the main need is interactive dashboards built around configurable filters.
Look beyond Jira when leaders need a combined view of delivery, sales, finance, or support data. Power BI and Tableau can serve that purpose, but account for connector setup, data modeling, licensing, and ongoing report ownership.
Consider ONES.com when your evaluation includes more than analytics, such as requirements, task breakdown, custom workflows, project tracking, and deployment control. Its free plan covers 30 seats, and Cloud and self-hosted options have feature parity.
Before deciding, test one real reporting scenario: for example, a sprint dashboard that shows completed work, blocked issues, and risks. Check whether the result is accurate, easy to maintain, and available to the people who need it.
Selection Summary and Final Recommendation
For a small team with basic reporting needs, Jira dashboards and reports are the simplest place to begin. Add a Jira reporting app when native views cannot answer specific delivery questions.
For cross-functional analysis, compare Power BI and Tableau against your existing data stack and reporting skills. If you also want to evaluate project management workflows, requirements, and hosting choices in one platform, include ONES.com in the shortlist.
Shortlist two or three options, build the same representative report in each, and compare accuracy, upkeep, access, and total cost. That practical test will reveal more than a feature checklist.
FAQ
Is Jira’s built-in reporting enough for agile teams?
It can be enough for common sprint, issue, and project views. Teams needing complex calculations, tailored dimensions, or combined data sources may need an add-on or external BI tool.
When should I use Power BI or Tableau instead of a Jira reporting app?
Consider them when reports need to combine Jira with data from other systems or serve broader business analysis. A Jira app may be simpler when the reporting scope stays within Jira.
Can these tools support both Cloud and self-managed Jira?
Not all options support every Jira edition. Check each tool’s current compatibility and deployment terms before selection, particularly for marketplace apps and cloud analytics services.
What should I test before choosing a Jira analytics tool?
Build a report from a real project or sprint, then verify its data, filters, sharing permissions, refresh behavior, and maintenance effort. Include licensing and any required connectors in the comparison.
FAQs About Jira Analytics
Is Jira’s built-in reporting enough for agile teams?
It can cover common sprint, issue, and project views. Teams needing complex calculations, tailored dimensions, or combined data sources may need an add-on or external BI tool.
When should I use Power BI or Tableau instead of a Jira reporting app?
Consider them when reports need to combine Jira with other systems or support broader business analysis. A Jira app may be simpler when reporting stays within Jira.
Can these tools support both Cloud and self-managed Jira?
Not all options support every Jira edition. Check current compatibility and deployment terms before choosing, particularly for marketplace apps and cloud analytics services.
What should I test before choosing a Jira analytics tool?
Build a report from a real project or sprint, then verify data accuracy, filters, permissions, refresh behavior, and maintenance effort. Include licensing and connectors in the comparison.