Build Jira Custom Reports: A 2026 Step-by-Step Process
Need clearer project insights? Build jira custom reports in 2026 with focused questions and reliable JQL. Click to learn the step-by-step process.
Jira gives you reports for common project questions, but the standard charts may not answer the questions your team actually asks. You might need to compare overdue work by team, track bugs by release, or see how quickly issues move between statuses.
When each person builds their own filter or interprets a chart differently, those numbers can become hard to compare. A report that looks polished but uses unclear definitions can lead your team toward the wrong decision.
But here's the truth: you can build useful Jira custom reports with a clear question, carefully written JQL, and the right dashboard gadgets. I’ll walk you through the process, show you how to check the results, and explain when Jira’s native reporting may need support from another approach.
How to build Jira custom reports: a step-by-step process
Start by choosing one decision your report should support. Then define the metric, create a saved JQL filter, add a suitable dashboard gadget, and verify the results with real issues.
Here’s why: a report is only useful when its filters, time period, and metric match the question. Use these steps to build one your team can understand and maintain.
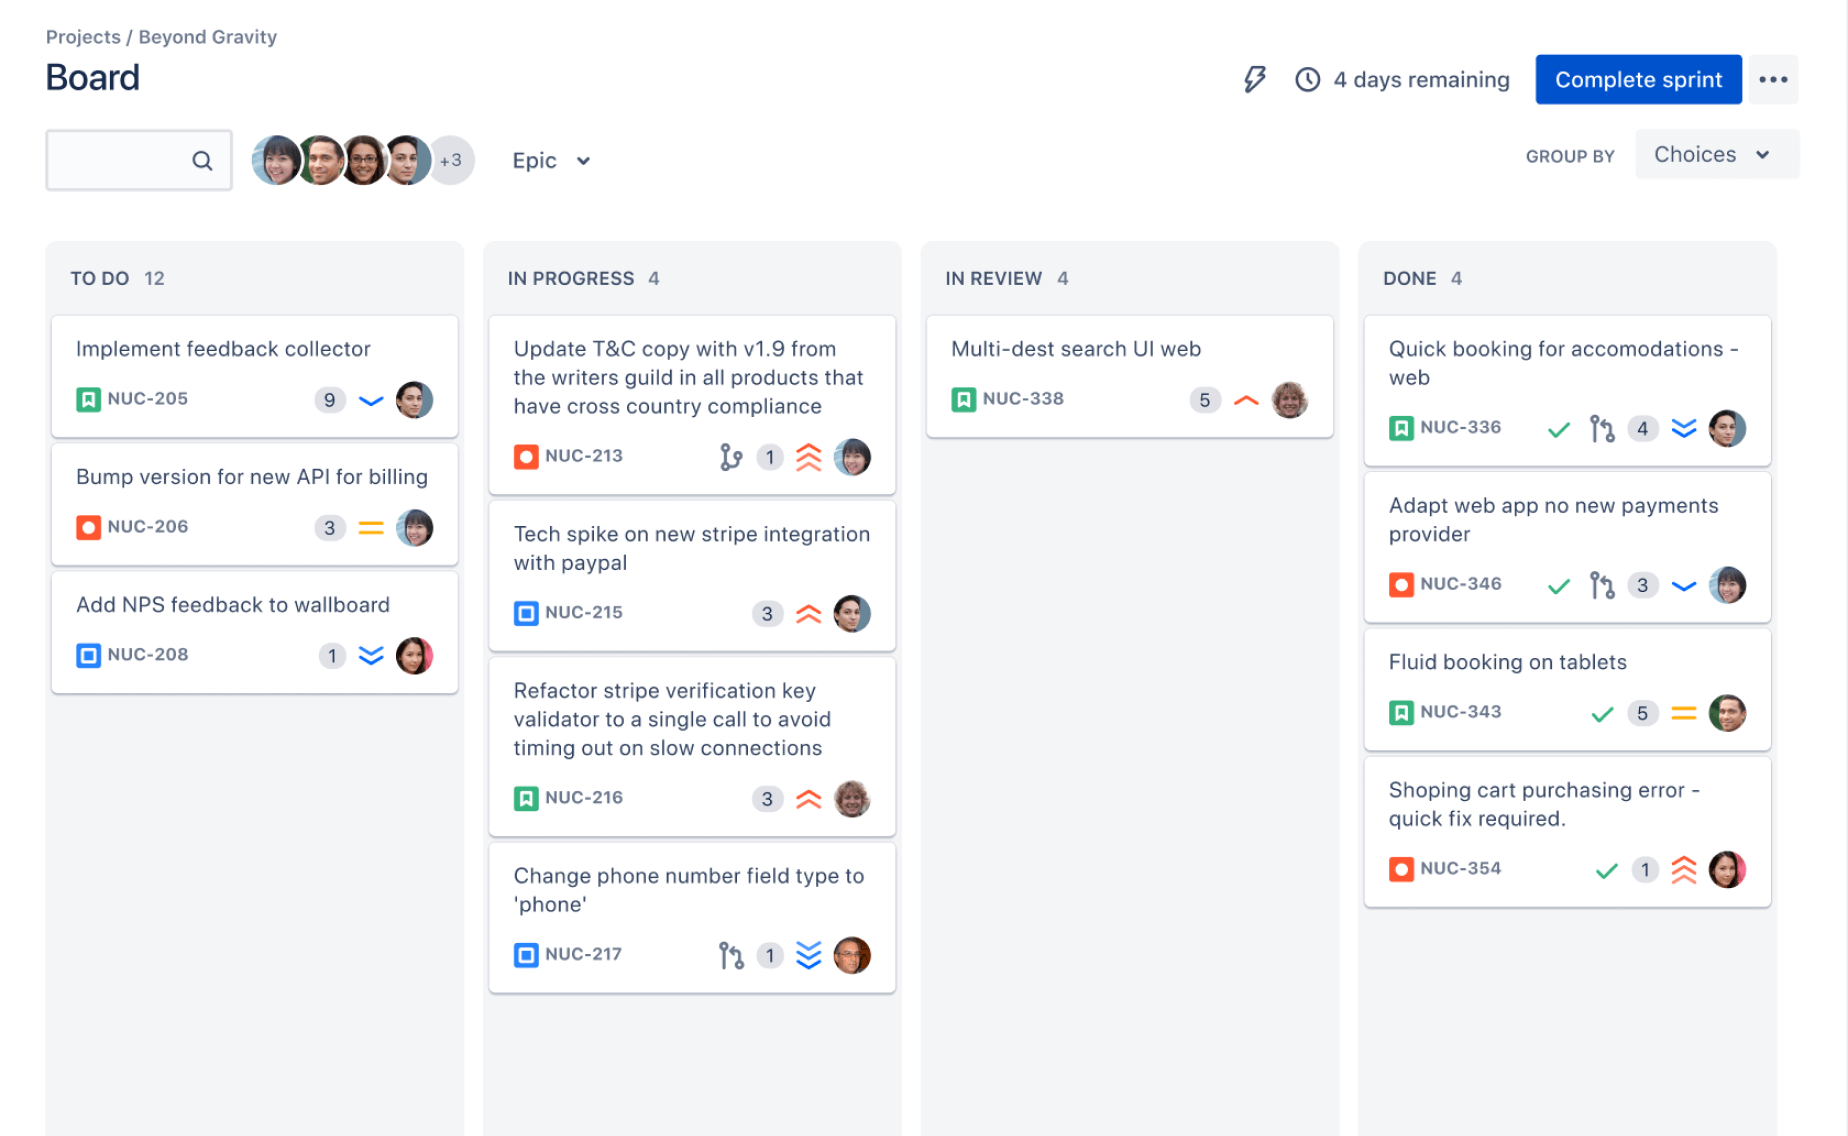
1. Choose a specific reporting question
Write the question in plain language before opening Jira. For example: “Which high-priority bugs assigned to the Payments team remain unresolved?” is more useful than “How is the project going?”
Decide who will use the report and what they should do after viewing it. A team lead might use a blocked-work report during daily planning, while a delivery manager might review completed work each month.
- Audience: Who needs the report?
- Decision: What action should it support?
- Scope: Which projects, teams, issue types, or releases belong in it?
- Timing: Should it show a current snapshot or a trend over time?
2. Define the metric and its boundaries
Choose what you will count or measure. For example, a “late issue” might mean an issue with a due date before today that is still unresolved.
Write down exclusions before creating the report. You may exclude canceled work, subtasks, or issues outside a particular release. Clear boundaries help prevent disagreements when two teams compare results.
You might be wondering: why define the metric first? Because “open work” can mean every unresolved issue, only work in progress, or only issues assigned to a person. Each definition creates a different result.
3. Create and test a JQL filter
Use Jira Query Language (JQL) to express the report’s rules. A starting query for unresolved, high-priority bugs in a particular project could look like this:
project = PAY AND issuetype = Bug AND priority in (Highest, High) AND resolution is EMPTY
Adjust project keys, issue types, and priority names to match your Jira configuration. Jira fields and permissions can differ, so check that each field is available to you.
Run the query, then inspect several matching issues. Also check a few issues you expect the query to exclude. This catches mistakes such as using the wrong project key or forgetting a status condition.
4. Save the filter and set its access
Save a query when it returns the right issues. Give the filter a descriptive name, such as “Payments: unresolved high-priority bugs,” so teammates can recognize its purpose.
Check who can view the saved filter. A dashboard may be visible to a wider audience than the filter behind it, so confirm that the intended viewers can access both.
Keep edit access limited to people responsible for maintaining the report. If a teammate changes the filter’s criteria without telling the audience, the report can shift meaning while keeping the same title.
5. Add a dashboard gadget that fits the question
Choose a Jira dashboard gadget that presents the result clearly. A Filter Results gadget can show an issue list, while a pie chart can group matching issues by a field such as status or assignee.
For a team investigating how much work remains, an issue list may be more actionable than a chart. For a quick view of issue distribution, a chart can reveal that most unresolved bugs belong to one component.
Configure the gadget to use your saved filter. Select only useful columns, set a reasonable number of displayed issues, and add a clear title that explains the scope.
6. Validate the report with real examples
Compare the gadget’s result with the issues returned by the filter. If the chart groups by status, check that the categories match the statuses your team uses.
Ask someone who did not create the report to interpret it. If they cannot explain what the numbers mean, add a short note to the dashboard or make the title more specific.
The best part? A five-minute review with a teammate can catch confusing labels before the report becomes part of a recurring meeting.
7. Share, review, and maintain it
Share the dashboard with its intended audience and explain what question it answers. Add a review date for reports tied to a sprint, release, or operational target.
Recheck the JQL when teams rename components, change workflows, or retire releases. A useful report needs occasional maintenance, just like the process it helps your team manage.
- Confirm the report still answers its original question.
- Check filter permissions and dashboard access.
- Review the fields and statuses used in the query.
- Remove gadgets that no longer support a decision.
What makes a Jira report genuinely useful?
A custom report combines a defined question, a repeatable way to select relevant issues, and a view that helps someone take action. It can be a focused issue list or a dashboard chart, depending on the decision.
Jira already includes reports for common planning and delivery needs. Scrum teams may use sprint reports or velocity charts, while Kanban teams may examine cumulative flow or cycle time. Custom reporting helps when your question falls outside those standard views.
For example, a release manager might need to see unresolved security issues assigned to a particular release. A saved filter and dashboard gadget can present that view without changing the team’s broader sprint reports.
Choose the right Jira reporting method
Jira’s built-in reports, saved filters, and dashboard gadgets serve different purposes. Pick the simplest approach that answers your question, then add complexity only when the reporting need requires it.
- Use a built-in report for a familiar question tied to a board or project, such as sprint progress.
- Use a saved filter when you need a repeatable set of issues that teammates can review or reuse.
- Use a dashboard gadget when an audience needs a visual summary or a quick issue list.
- Consider an app or integration when you need advanced calculations, cross-project visuals, or specialized reporting features that native Jira views do not provide.
Let me explain: a gadget is a presentation, not a substitute for a sound query. If your filter includes the wrong issues, a chart can make the mistake look convincing rather than exposing it.
Suppose you want to track work completed during a sprint. A sprint report may be the best starting point. If you need to compare completed issues by component across several teams, a custom filter or another reporting method may fit better.
Write JQL that people can understand and maintain
A reliable JQL query uses the smallest set of conditions that accurately represents the report. Simple queries are easier to test, explain, and update when your Jira setup changes.
For example, a team tracking unresolved work in a release might start with a query like this:
project = PAY AND fixVersion = "Release 4.2" AND resolution is EMPTY
Use the real project key and release name in your Jira site. If your team uses multiple status categories or custom fields, check that the query reflects the workflow you actually follow.
Use field values that match your configuration
Jira projects can use different issue types, priorities, components, and workflows. A query copied from another team may return nothing or include the wrong issues if those values differ.
Test unfamiliar field names and values in Jira’s query interface. Add conditions one at a time, then compare the results after each change. This makes it easier to locate a clause that narrows the result unexpectedly.
Be precise about time and status
Time conditions can change what a report means. “Updated in the past seven days” differs from “created in the past seven days,” even when both seem like recent activity.
Status names also need attention. A workflow may include several statuses that represent work in progress, so filtering for one status alone may leave out related issues.
Keep reusable queries readable
Use clear filter names and descriptions that explain the audience, scope, and purpose. When a query includes several conditions, add a short note to the dashboard about its definition.
For instance, a filter called “Open work” is vague. “Payments: unresolved production bugs” tells a teammate what the query covers before they open it.
Design dashboards around decisions, not decoration
A useful dashboard helps people answer a question quickly. It does not need every chart Jira can display; it needs the few views that guide a decision.
Imagine a support lead reviewing a dashboard before a triage meeting. A compact list of urgent unresolved bugs, grouped by assignee, may be more helpful than six charts with overlapping information.
Arrange gadgets in the order people use them. Put urgent exceptions near the top, followed by context such as issue trends or work grouped by component. A clear layout reduces the time spent searching for the next action.
Match the visual to the message
Use an issue list when people need to inspect specific work. Choose a chart when comparing categories or spotting a pattern matters more than opening individual issues.
A pie chart showing issue counts by priority can make a distribution easy to scan. It may be a poor choice for comparing changes over several weeks, where a trend-oriented view would communicate more clearly.
Label every view clearly
Give each gadget a title that includes its scope or time period. “Unresolved payment bugs” is more helpful than “Bug report,” especially when a dashboard contains views from several projects.
If a number has a special definition, explain it beside the gadget. For example, clarify whether “overdue” means a missed due date or a target date that falls within the current sprint.
Check report quality before sharing it
Before sharing a report, test its accuracy, clarity, permissions, and usefulness. A chart can be technically correct yet still mislead people if its scope or time period is unclear.
- Accuracy: Do sample issues match the filter’s rules?
- Coverage: Are relevant teams, issue types, and statuses included?
- Clarity: Can a teammate explain the metric and reporting period?
- Access: Can the audience view both the dashboard and saved filter?
- Action: Does the report help someone decide what to do next?
For example, ask a teammate to identify which issues are overdue and why. If they interpret the result differently from you, revise the query or add a definition before presenting it to a larger group.
Also check whether the report is still useful after a workflow change. A renamed status or retired release can quietly make a saved filter less relevant.
Jira custom reporting solution: ONES.com
Value proposition
ONES.com brings project management and knowledge management together in one platform, with ONES Project providing project management capabilities. Teams evaluating a Jira alternative can compare its reporting and workflow options with their current reporting process.
ONES Project is sold separately from ONES Wiki. ONES Wiki is a knowledge management product and a Confluence alternative; the platform also supports cloud and self-hosted deployments.
Core capabilities
- Reporting spread across multiple views: ONES Project includes built-in reporting, helping teams review project work without assembling every view from separate plugins.
- Workflows that do not match your process: Custom workflows let teams shape issue movement around their own review and delivery steps, making reports more relevant to actual work.
- Fields that omit needed context: Custom fields let teams capture project-specific details, so work can be organized around information the team needs to track.
- Sprint planning needs: Sprint management supports teams organizing and reviewing sprint work within their project workflow.
- Repetitive task handling: Automation can reduce manual steps in routine project processes, giving teams more consistent work transitions.
- Existing Jira workflow familiarity: Jira-compatible workflows can make it easier for teams to map familiar project processes into an alternative environment.
- Plugin-heavy setups: Native capabilities can reduce reliance on plugins for supported needs, simplifying administration when teams can consolidate functionality.
- Deployment restrictions: Cloud, On-Premise, Private Cloud, and Air-gapped deployment options give organizations choices that fit their hosting requirements.
ONES.com offers a free plan for up to 30 seats. Its cloud and self-hosted versions have full feature parity, which can help teams compare deployment choices without assuming that self-hosting means fewer product capabilities.
Application scenarios
A team reviewing a Jira alternative: A project group can compare its current JQL filters, dashboards, custom fields, and sprint needs with ONES Project’s workflow and reporting capabilities. This creates a practical evaluation around day-to-day work instead of feature names alone.
An organization with restricted hosting requirements: A team that cannot place project management in a public cloud can assess On-Premise, Private Cloud, or Air-gapped deployment options. It should also verify its own security and operational requirements during evaluation.
ONES.com is most relevant when your team is assessing project management platforms, deployment choices, or reliance on add-ons. If your existing Jira reports meet your needs, you may not need to change platforms.
Common challenges when building Jira reports
Challenge: The report returns too many issues
Why it happens: The query may cover an entire project or omit a condition such as issue type, release, or status.
What to do: Add one scope condition at a time, then inspect the results. Avoid adding conditions you cannot explain, since they can hide relevant work.
Challenge: Teammates get different results
Why it happens: People may use separate filters, different time periods, or inconsistent definitions for the same metric.
What to do: Share one maintained filter and state its scope. Note whether the view reflects a current snapshot, a fixed period, or a specific sprint.
Challenge: A dashboard chart is hard to interpret
Why it happens: The chart may group issues by a field that does not support the intended decision. The title may also leave its scope unclear.
What to do: Use a chart for comparisons and an issue list for follow-up. Rename the gadget to explain what it shows, and add a short metric definition when needed.
Challenge: The report becomes outdated
Why it happens: Teams change workflows, releases, ownership, or project conventions over time.
What to do: Assign an owner and set a regular review point. After a process change, retest the filter against a few known issues.
FAQs about custom Jira reports
Can I create a custom Jira report without an app?
Yes. You can use JQL to create a saved filter, then display it through available Jira dashboard gadgets. This approach works well for focused issue lists and common visual summaries. If you need complex calculations, specialized charts, or reporting across systems, Jira’s native options may not cover every requirement, so assess an app or integration.
What is the difference between a Jira filter and a report?
A filter selects issues that match your criteria, often through JQL. A report presents or summarizes that selection so people can review it. A saved filter can power a dashboard gadget, which means one carefully maintained query may support several useful views.
How do I make a Jira report visible to my team?
Check sharing permissions for both the saved filter and the dashboard. Teammates need access to the filter behind a gadget as well as permission to view the dashboard. Confirm access with someone in the intended audience, particularly when the report includes sensitive project details.
Why does my custom report show different results than expected?
Check the JQL conditions, field values, project scope, permissions, and time settings. A status name or issue type may differ from what you expect in a particular project. Test the query against a few issues that should appear and a few that should not, then adjust one condition at a time.
Conclusion
Jira custom reports work best when they answer a specific question with a clearly defined metric. Build the query carefully, choose a view that supports a decision, and test it with real issues before sharing it.
But here's the truth: a report cannot fix unclear processes or inconsistent definitions by itself. Give each report an owner, revisit it when workflows change, and remove views that no longer help your team act.
If Jira’s native reporting meets your needs, a saved filter and dashboard gadget may be enough. If you are comparing platforms or need different deployment options, evaluate ONES Project and ONES.com against the way your team plans, tracks, and reviews work.