How to Create a Jira Dashboard: 7 Steps With Examples (2026)
Need to spot Jira blockers faster? Learn how to create dashboard in Jira in 7 steps with examples to track progress and organize useful gadgets. Read now.
Jira dashboards can quickly become cluttered with charts that look useful but do not help you decide what to do next. If key metrics sit behind several clicks, your team may miss a blocked issue or a sprint falling behind. To create a useful Jira dashboard, create the dashboard, add relevant gadgets, connect them to suitable filters, then arrange and share the finished view. I’ll walk you through seven steps using practical examples, from choosing a clear purpose to checking who can see each gadget. You’ll also learn how to avoid common setup mistakes, such as choosing charts before deciding what questions your dashboard should answer.
How to Create a Jira Dashboard in 7 Steps
Start with one audience and one purpose. A sprint dashboard for developers needs different information from an executive view of several projects.
-
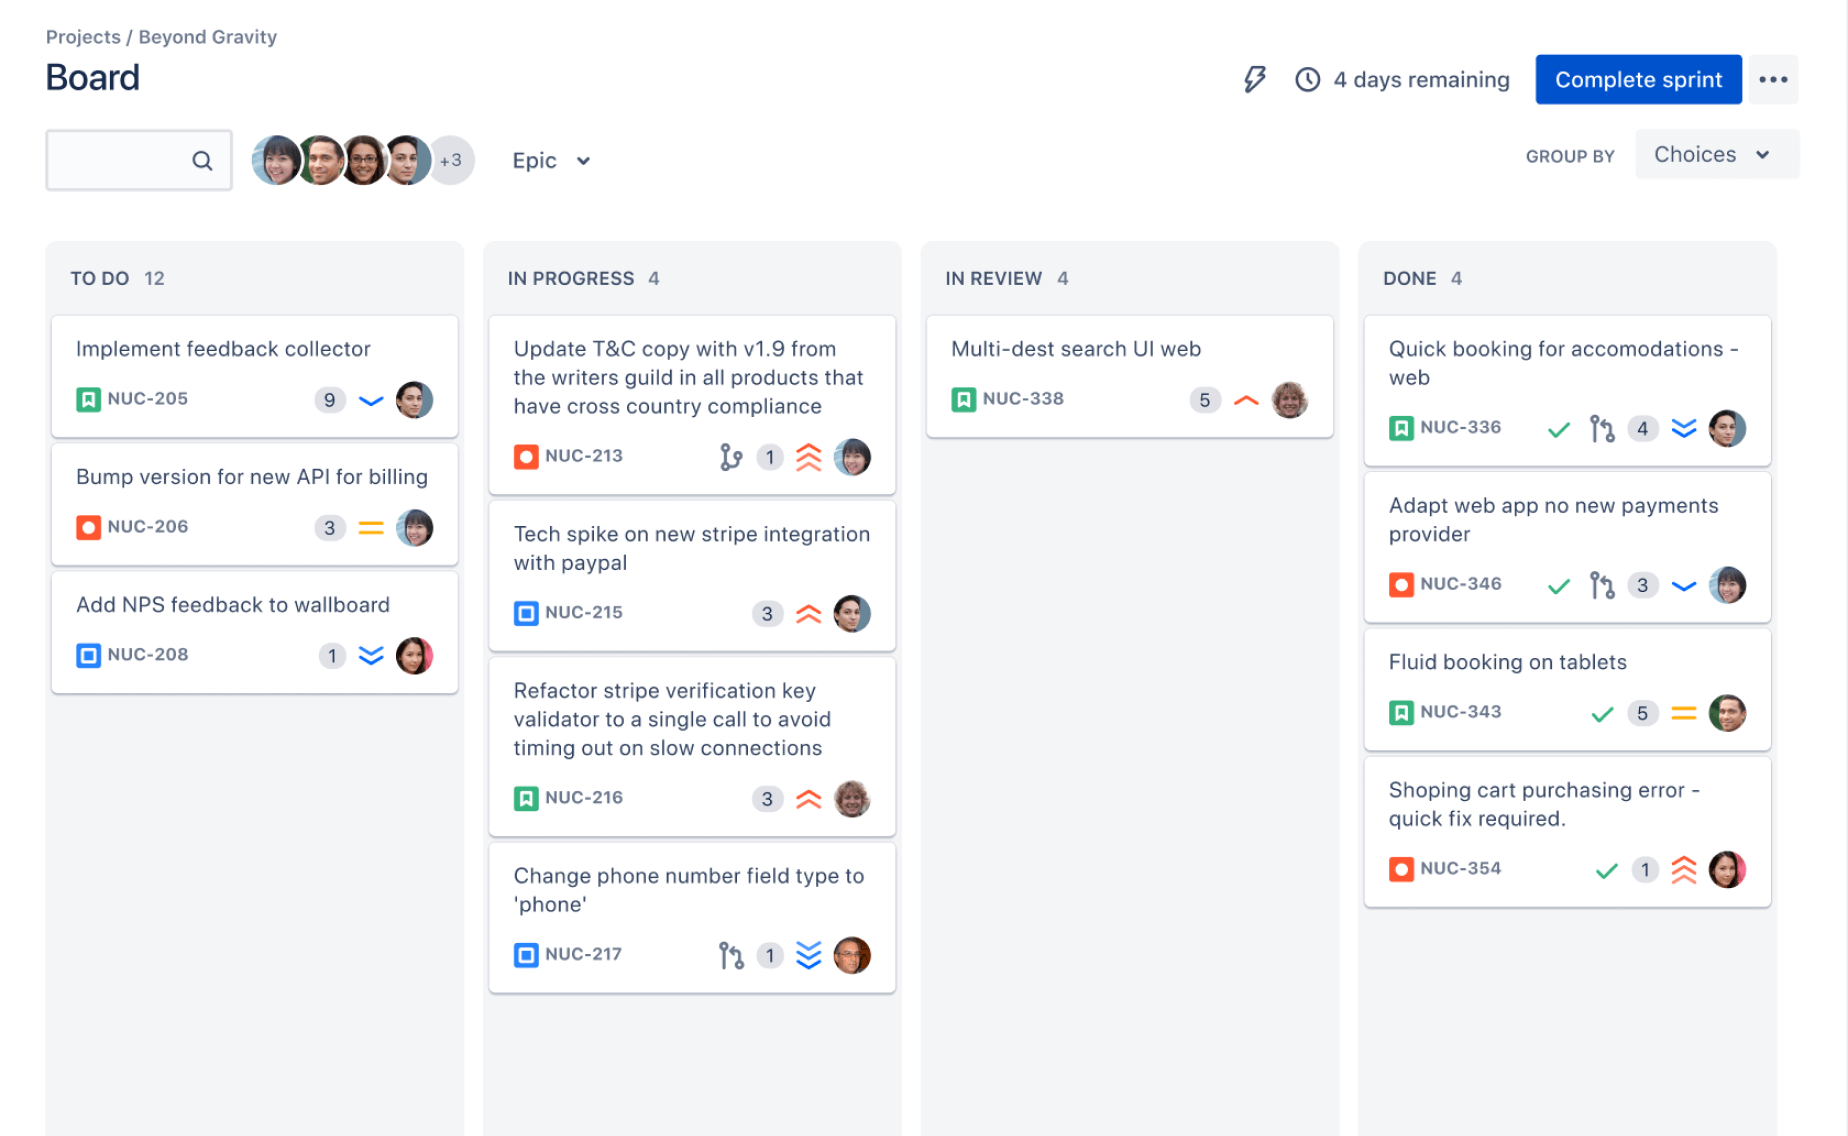
1. Decide what the dashboard needs to answer
Write down the decisions the dashboard should support before you add gadgets. For example, a team lead might need to answer: “What is blocked?”, “Are we likely to finish the sprint?” and “How many bugs remain open?”
Keep the first version focused on three to five questions. A dashboard with a clear purpose is easier to scan and maintain than a wall of unrelated charts.
-
2. Create a new dashboard
In Jira, open Dashboards and select Create dashboard. Give it a specific name, such as “Mobile App Sprint Review,” so people can tell what it covers.
Add a short description that explains the audience and purpose. If Jira offers the option, you can also start with a copy of an existing dashboard you can access, then change its gadgets and settings.
-
3. Set dashboard access
Choose whether the dashboard is private or shared with particular people, groups, or project roles. The available sharing choices depend on your Jira permissions and configuration.
Check the permissions on any saved filters used by gadgets, too. Someone may be able to open the dashboard but see missing results if they cannot access the filter behind a gadget.
-
4. Add gadgets that match your questions
Choose Add gadget and look for gadgets that answer the questions you listed. A Filter Results gadget can show a short list of unresolved blockers, while a Pie Chart can break down issues by status or priority.
For a project overview, a Created vs. Resolved chart can help show whether incoming work is outpacing completed work. Sprint gadgets, such as a burndown chart, are more useful when the team has an active sprint and a configured board.
Start with a few gadgets. Adding every available chart can make the page slower to understand without making the work clearer.
-
5. Configure each gadget with the right filter
Most issue-focused gadgets need a saved Jira filter. Create or select a filter that matches the dashboard’s purpose, then choose it in the gadget settings.
For example, a team might use a filter for open high-priority bugs in its current project. A filter for “all issues updated this month” would show a different story, even if both feed the same chart.
Check the time range, project, issue type, and status settings. A chart can be technically correct yet misleading if its filter includes old work or unrelated projects.
-
6. Arrange the layout for quick scanning
Drag gadgets into an order that follows the way someone will use the page. Put urgent information, such as blocked work, near the top; place trend charts lower down.
Choose a layout that gives the most important gadgets enough room to display their titles, labels, and results. For example, a wide chart may be easier to read in a full-width column than squeezed beside several narrow gadgets.
-
7. Review the dashboard with its intended audience
Open the dashboard as a person who needs to use it. Confirm that the gadgets load, the filters return the expected issues, and the sharing settings allow the right people to see the page.
Ask a teammate to locate one important answer, such as the number of unresolved blockers. If they need instructions to interpret the page, simplify the layout or clarify gadget names and filters.
Choose Gadgets That Make Jira Work Visible
Gadgets are useful when each one answers a distinct question. A Filter Results gadget supports action: someone can see which issues need attention. A Pie Chart supports comparison: someone can spot how work is divided by status or priority.
Here's why: charts only help when their filters and labels make sense to the people reading them. A sprint burndown chart, for instance, can help a team track remaining work during an active sprint. It is less useful on a general management dashboard that covers several unrelated projects.
Try this practical set for a sprint team: a short blocker list, a burndown chart, and a Created vs. Resolved chart. Each view serves a different purpose, and the team can remove any gadget that does not lead to a useful discussion.
Use Filters and Permissions Carefully
A gadget’s results depend on its filter, and its visibility can depend on both dashboard sharing and filter permissions. Treat those settings as two separate checks rather than assuming dashboard access grants access to everything inside it.
For example, a project lead may share a dashboard with a group but forget to share the saved filter used by its issue list. Some teammates could then see a blank gadget or a permissions message instead of the expected results.
Let me explain: test the dashboard with an intended viewer account, not only with your administrator access. Confirm that the filter returns the correct project and issue types, then make sure the people who need the view can access it.
Examples of Dashboards for Different Teams
A sprint team can arrange its dashboard around daily decisions. Put current blockers first, sprint progress next, and a work-by-priority chart after that. This makes the page useful during stand-ups without turning it into a second backlog.
A support team might use a Filter Results gadget for urgent open tickets, then compare created and resolved issues over a set period. If new requests consistently exceed resolved requests, the chart can prompt a conversation about capacity or triage.
For project leadership, choose a small number of views that compare work across projects. A pie chart grouped by status may help reveal where issues are accumulating. Keep project-specific sprint details on team dashboards, where the people acting on them can see the context.
Keep the Dashboard Useful Over Time
A dashboard can become stale as a project changes. Review its gadgets when a sprint ends, a project closes, or the team changes how it tracks work. Remove views that no longer support a decision.
You might be wondering: how often should you review it? A simple team dashboard can be checked during a regular retrospective or planning session. A high-traffic support dashboard may need more frequent checks if its filters or priorities change often.
Use clear names for dashboards, gadgets, and saved filters. “Open blockers for Mobile App” is easier to understand than “Filter 12.” That small naming choice helps teammates tell what a view includes before relying on it.
Project Management and Reporting with ONES.com
Value Proposition
If your team is reassessing Jira because project tracking and reporting feel difficult to manage, ONES.com offers a project management alternative through ONES Project. It combines project workflows, sprint management, automation, and built-in reporting, with options for cloud or self-hosted deployment.
Core Capabilities
- Multiple project views: When teams need different ways to manage work, ONES Project provides project management features and reporting in one product. This can help reduce dependence on separate plugins for everyday project needs.
- Jira-compatible workflows: When a team wants familiar workflow patterns, Jira-compatible workflows can help it organize work in a recognizable way. Teams can shape how issues move through stages without relying on a fixed process for every project.
- Custom workflows: When a standard workflow does not match how a team works, custom workflows let the team define its own process. That can make ownership and issue progression clearer.
- Custom fields: When projects need to track details beyond basic issue information, custom fields let teams capture relevant attributes. People can then organize work around the details their process requires.
- Sprint management: When an agile team plans work in iterations, sprint management supports that workflow. The team can keep planning and execution within its project management environment.
- Built-in reporting: When teams want project progress at a glance, built-in reporting provides reporting capabilities within ONES Project. This may reduce the need to assemble routine reporting from extra plugins.
- Automation: When repetitive workflow actions take time, automation can handle supported routine steps. Teams can spend less effort on manual follow-up and more on the work itself.
- Deployment choice: When hosting or network requirements shape tool selection, ONES.com supports Cloud, On-Premise, Private Cloud, and Air-gapped deployments. The self-hosted version has feature parity with the cloud version.
Application Scenarios
A software team that already plans work in sprints can assess ONES Project as a Jira alternative. It can compare workflow needs, custom fields, sprint management, and reporting requirements before deciding whether a change makes sense.
An organization with restricted network requirements can consider a self-hosted deployment, including an air-gapped option. A team that also needs knowledge management can evaluate ONES Wiki separately; ONES Project and ONES Wiki are sold separately.
Common Challenges When Building Jira Dashboards
Too many gadgets compete for attention
Problem: The page has numerous charts, but people cannot identify the most urgent information. Solution: Return to the decisions the dashboard should support. Remove gadgets that duplicate another view or do not prompt an action.
A gadget shows no results
Problem: A chart or issue list appears empty even though the project has active work. Solution: Check the saved filter’s criteria and sharing permissions. Test the filter directly, then review whether the dashboard viewer can access it.
Charts are difficult to interpret
Problem: A chart includes unrelated projects, old issues, or unclear categories. Solution: Narrow the filter, review the time range, and give the gadget a descriptive title. Ask a teammate what they think the chart shows before relying on it.
People can open the dashboard but cannot see everything
Problem: Dashboard sharing is configured, but one or more gadgets show access errors. Solution: Check both dashboard access and the permissions for the saved filters or projects used by those gadgets.
FAQs About Jira Dashboards
Can I create a Jira dashboard without being an administrator?
Often, you can create a personal dashboard if your Jira permissions allow it. However, sharing options and access to particular gadgets, projects, or filters may depend on your organization’s configuration. If you do not see the create option or cannot share the dashboard, ask your Jira administrator which permissions apply to your account.
What gadgets should I add to a Jira dashboard?
Choose gadgets based on the questions your audience needs to answer. A team tracking a sprint might use a burndown chart and a short list of blocked issues. A project lead may prefer a status breakdown or a Created vs. Resolved chart. Begin with a few relevant views, then add more only when they provide useful information.
Why is a Jira dashboard gadget blank?
A blank gadget may use a filter that returns no matching issues, or its viewer may not have permission to access the filter or project. Open the saved filter directly and check its project, status, date, and issue-type criteria. Then confirm the intended viewers have the access required to see those results.
Can I share a Jira dashboard with my team?
Jira dashboards can generally be shared with selected people or groups when your permissions allow it. Dashboard access and filter access are separate, so check both before sending the link. Test the page as a teammate to confirm that its gadgets show the expected results rather than permission messages or empty charts.
Can I make a Jira dashboard the default view?
Jira may let you set a dashboard as your default landing page, depending on your account permissions and configuration. Look for the dashboard’s options or preferences after creating it. If the setting is unavailable, your administrator may control default landing pages or restrict changes to individual accounts.
Conclusion
A useful Jira dashboard starts with a clear purpose, not a collection of charts. Create it for a specific audience, choose gadgets that answer real questions, and verify filters and permissions before sharing the page.
But here's the truth: a dashboard only helps when people can understand and act on what it shows. Keep the layout focused, check it as your project changes, and remove views that no longer serve the team. If Jira’s project management setup no longer fits your needs, ONES Project is one alternative to assess against your workflows, reporting, and deployment requirements.