Jira Analytics: A 7-Step Guide to Clearer Project Insights
Is your Jira project on track? Use this 7-step Jira analytics guide to turn issue data into clear insights. Read now and plan with confidence.
Project work can generate plenty of charts while leaving you unsure whether delivery is on track. A dashboard may show completed issues, yet hide a growing queue of blocked work or a sprint that is slipping.
That uncertainty makes planning harder. Teams can react to a late release without seeing the warning signs, or spend meetings debating numbers that mean different things to different people.
Jira analytics can help you turn issue activity into useful project insights. The key is choosing meaningful measures, configuring reports with care, and reviewing trends in context. Here’s a practical seven-step approach to building a clearer view of delivery, workload, and risk.
How to build clearer project insights in Jira
Start with a decision you need to make, then choose the metrics and Jira reports that can inform it. These seven steps help you move from scattered charts to a useful project view.
-
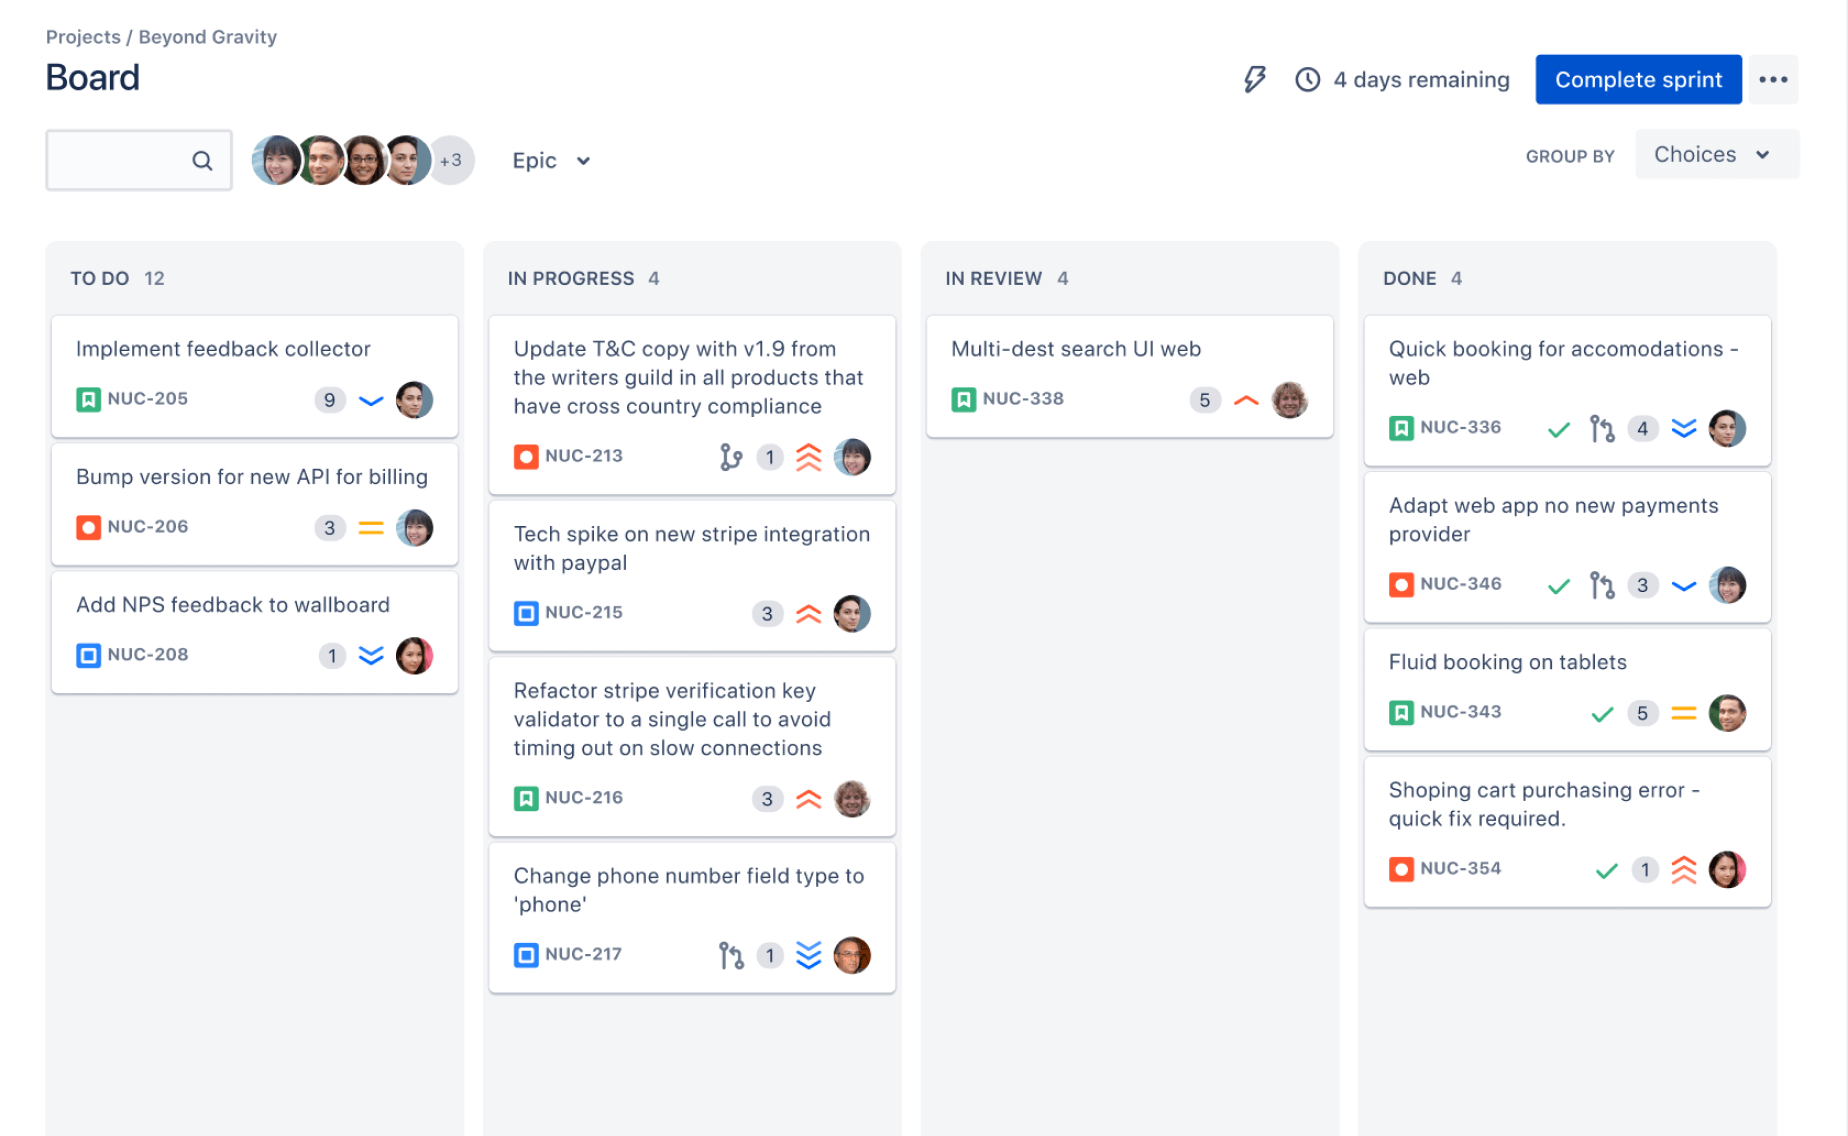
Choose the project question first
Begin with a decision, not a chart. Ask what you need to know: Is the sprint likely to finish on time? Where are issues getting stuck? Is incoming work outpacing completed work?
For example, a delivery lead worried about missed sprint goals needs a different view from a support manager tracking unresolved requests. Writing down the question prevents a dashboard from filling with metrics that look interesting but do not guide action.
-
Check whether your Jira issues are consistent
Reports are only as useful as the issue information they summarize. Review whether teams use statuses, issue types, priorities, and estimates consistently. If one team marks work “Done” while another uses “Closed,” a comparison may mislead you.
Agree on practical conventions before interpreting trends. You might define which statuses count as active work, how teams record blocked issues, and when an issue should be split into smaller tasks.
-
Pick a small set of decision-ready metrics
Match metrics to the question. Sprint burndown can show remaining work over time; velocity can help a team plan future sprints; a control chart can reveal changes in cycle time.
For flow, a cumulative flow diagram can highlight growing queues. Created-versus-resolved charts help show whether new work is arriving faster than the team closes it. Choose a few measures people can explain without a lengthy presentation.
-
Use Jira reports for the right level of detail
Jira includes reports for different project needs, but they answer different questions. Sprint reports focus on a sprint’s work, while a control chart helps you examine how long issues take to move through a workflow.
Use a detailed report to investigate a pattern, then share a simpler dashboard view for regular check-ins. If a sprint burndown chart shows a late spike, inspect the sprint report and issue history to understand what changed.
-
Build a dashboard around an audience
A project team may need a current sprint view, while an executive may need release progress and emerging risks. Create dashboards around those distinct needs instead of asking one crowded dashboard to serve everyone.
Place the most important chart near the top and give each gadget a clear title. A chart called “Open issues by status” is easier to interpret than “Issue statistics,” especially when someone views it without you there to explain it.
-
Check trends before drawing conclusions
A single chart snapshot rarely explains why performance changed. Compare several sprints or weeks, then check for context such as scope changes, holidays, urgent support work, or a team’s shift to smaller issues.
For instance, a sudden rise in cycle time might reflect a few complex tasks rather than a broad delivery problem. Pair a metric with issue-level investigation before changing commitments or processes.
-
Set a review rhythm and act on what you learn
Choose a regular time to review the dashboard, such as sprint planning or a weekly delivery meeting. Assign someone to investigate unusual changes and agree on what action follows.
If unresolved work has climbed for three weeks, the team might limit new intake or remove a recurring approval delay. Record the decision and check the next review to see whether the change helped.
Which Jira metrics are useful for project decisions?
Useful metrics connect to a question your team can act on. Velocity, for example, can support sprint planning when a team has a stable history and a consistent way to estimate work. It is less useful as a score for comparing different teams.
For a team concerned about delivery flow, cycle time and a cumulative flow diagram can reveal where work waits. If issues collect in “In Review,” you have a prompt to examine review capacity or handoffs, rather than simply asking people to work faster.
Here’s why: each metric has limits. A burndown chart can show remaining work, but it may not explain scope changes. A created-versus-resolved chart can show workload pressure, but it does not tell you whether every issue has equal importance.
How to design a Jira dashboard people can read
Make the dashboard answer a small number of questions at a glance. A team dashboard might show sprint progress, unresolved blockers, and work by status. A leadership view could focus on release progress, risks, and changes to delivery forecasts.
Imagine opening a dashboard and seeing twelve charts with unclear titles. You would need to investigate each one before deciding what matters. Reduce the clutter, name each chart in plain language, and put the most time-sensitive information first.
Use filters carefully so every chart reflects the intended project, team, or time period. If someone changes a filter or project scope, confirm that the dashboard still answers its original question.
How to interpret trends without jumping to conclusions
Look for patterns across multiple periods, then ask what changed in the work. A rising backlog might point to increasing demand, limited capacity, or a workflow bottleneck. The chart signals a question; it does not establish the cause on its own.
For example, a team could see more issues marked “In Progress” late in a sprint. That might mean work started too early, tasks are too large, or reviews are delaying completion. Check individual issues and talk with the team before deciding which explanation fits.
Compare like with like. A team’s current sprint may be unusually short, include a major release, or contain more support work than usual. Context helps you avoid treating an unusual period as a new normal.
How to keep Jira reporting reliable over time
Reporting needs a light maintenance routine. Review filters, status definitions, and dashboard ownership whenever teams change their workflow. A chart can quietly become misleading if it excludes a new issue type or continues to track an old project.
Set expectations about how teams update issues. If people leave work in progress after it is finished, the charts will reflect outdated status information. A brief reminder in sprint planning can be more effective than adding another report.
The best part? You do not need to measure everything. Keep the metrics that help people make decisions, remove charts that no one uses, and revisit the dashboard when project goals change.
Jira analytics solution: ONES.com

Value proposition
ONES.com brings project management and knowledge management together in one platform, with AI support through ONES Assistant. Teams evaluating Jira alternatives can use ONES Project for project work and reporting, while ONES Wiki supports shared knowledge; the products are sold separately.
Core capabilities
- Scattered project information: ONES Project provides project management features in a unified platform, helping teams keep work and project reporting connected.
- Jira migration concerns: Jira-compatible workflows can ease the move for teams that want familiar processes while evaluating a Jira alternative.
- Rigid workflows: Custom workflows and fields let teams represent their own work stages, so reporting can reflect how work actually moves.
- Unclear sprint progress: Sprint management and built-in reporting help teams review progress and discuss delivery changes during planning.
- Repetitive task handling: Automation can reduce routine work, leaving teams with more time to review exceptions and project trends.
- Too many add-ons: Native capabilities can reduce reliance on plugins for common project needs and simplify the environment teams maintain.
- Knowledge spread across separate spaces: ONES Wiki provides knowledge management as a separate product, giving teams an option for maintaining project guidance and shared practices.
- Deployment constraints: ONES.com offers Cloud, On-Premise, Private Cloud, and Air-gapped deployments. Its cloud and self-hosted versions have full feature parity.
Application scenarios
A software team replacing Jira could configure compatible workflows, custom fields, and sprint reporting in ONES Project. During sprint reviews, team members could inspect progress and discuss bottlenecks using the project’s reporting capabilities.
A company with restricted network requirements could assess an On-Premise, Private Cloud, or Air-gapped deployment. Teams looking for a lower-risk evaluation can start with the free plan, which supports up to 30 seats.
ONES.com is worth considering when deployment flexibility, native project capabilities, or fewer add-ons matter in a platform decision. Compare the fit against your workflows, reporting needs, and operating requirements before choosing.
Common challenges with Jira project reporting
- Charts disagree with what the team sees: Check filters, issue statuses, and update habits. A dashboard can miss work if its filter excludes a project area or an issue type that recently became relevant.
- People treat velocity as a performance score: Explain that velocity supports planning within a team. Use it to estimate future work cautiously, rather than ranking teams with different practices or issue sizes.
- Dashboards become crowded: Remove charts that do not support a current decision. Keep separate dashboards for audiences with different questions instead of adding every possible gadget to one view.
- A metric changes, but the reason is unclear: Compare several periods and investigate the underlying issues. Ask about scope, staffing, workflow, and interruptions before deciding what action to take.
- Reports are reviewed without follow-up: End each review with an owner and a next step. If the team spots a growing review queue, for example, assign someone to explore the delay and report back.
Frequently asked questions about Jira reporting
What can Jira analytics help a project team understand?
Jira analytics can help a team examine sprint progress, work in progress, issue resolution, workload trends, and delivery flow. Jira reports and dashboards summarize activity recorded in projects, making it easier to spot patterns and raise questions. They do not automatically explain why a pattern occurred, so teams should review the work and surrounding context before making a decision.
Which Jira report should I use to track sprint progress?
A sprint burndown chart is a useful starting point because it shows remaining work across a sprint. Use the sprint report when you need more detail about completed, incomplete, or added work. If your question concerns how long issues take to move through a workflow, a control chart may be more relevant than a burndown.
Can Jira dashboards predict whether a project will finish on time?
Dashboards can help you assess delivery trends, remaining work, and potential risks, but they cannot guarantee a finish date. Forecasts depend on factors such as scope, issue estimates, team capacity, and unexpected work. Review multiple periods and update expectations when conditions change. Treat a dashboard as decision support, then communicate uncertainty clearly.
How many metrics should a Jira dashboard include?
There is no fixed number that works for every team. Include enough metrics to answer the dashboard’s main questions without making it difficult to scan. A sprint dashboard might need progress, blockers, and work by status. If people cannot explain why a chart is there or what action it supports, consider removing it.
Conclusion
Clearer project insights come from asking focused questions, choosing relevant Jira reports, and reviewing trends with context. Start with one decision your team needs to make, then build a dashboard that supports it.
But here's the truth: charts alone will not fix unclear workflows or inconsistent updates. Keep issue practices reliable, discuss unexpected changes, and assign follow-up actions. That turns reporting into a practical part of project planning rather than a collection of numbers.
If Jira’s built-in reporting and your team’s workflow are no longer a comfortable fit, assess alternatives such as ONES Project against your reporting, deployment, and process needs. Better project visibility begins with measures people understand and decisions they can act on.