Jira Dashboards: A Practical Guide to Clearer Project Views
Struggling to spot project risks? Build a clearer Jira dashboard with focused gadgets, filters, and sharing tips. Read now to improve project views.
Project updates often arrive in separate places, leaving you to piece together what is late, blocked, or moving.
A crowded Jira dashboard can make that harder. Too many gadgets compete for attention, while important risks disappear below the fold.
Then stand-ups become status hunts instead of decisions, and stakeholders ask for reports you thought they could already see.
But here's the truth: a useful dashboard is not a wall of charts. It is a focused view built around specific questions and reliable filters.
This guide shows you how to plan, build, share, and maintain a Jira dashboard that helps each audience act faster.
A practical overview of Jira dashboards
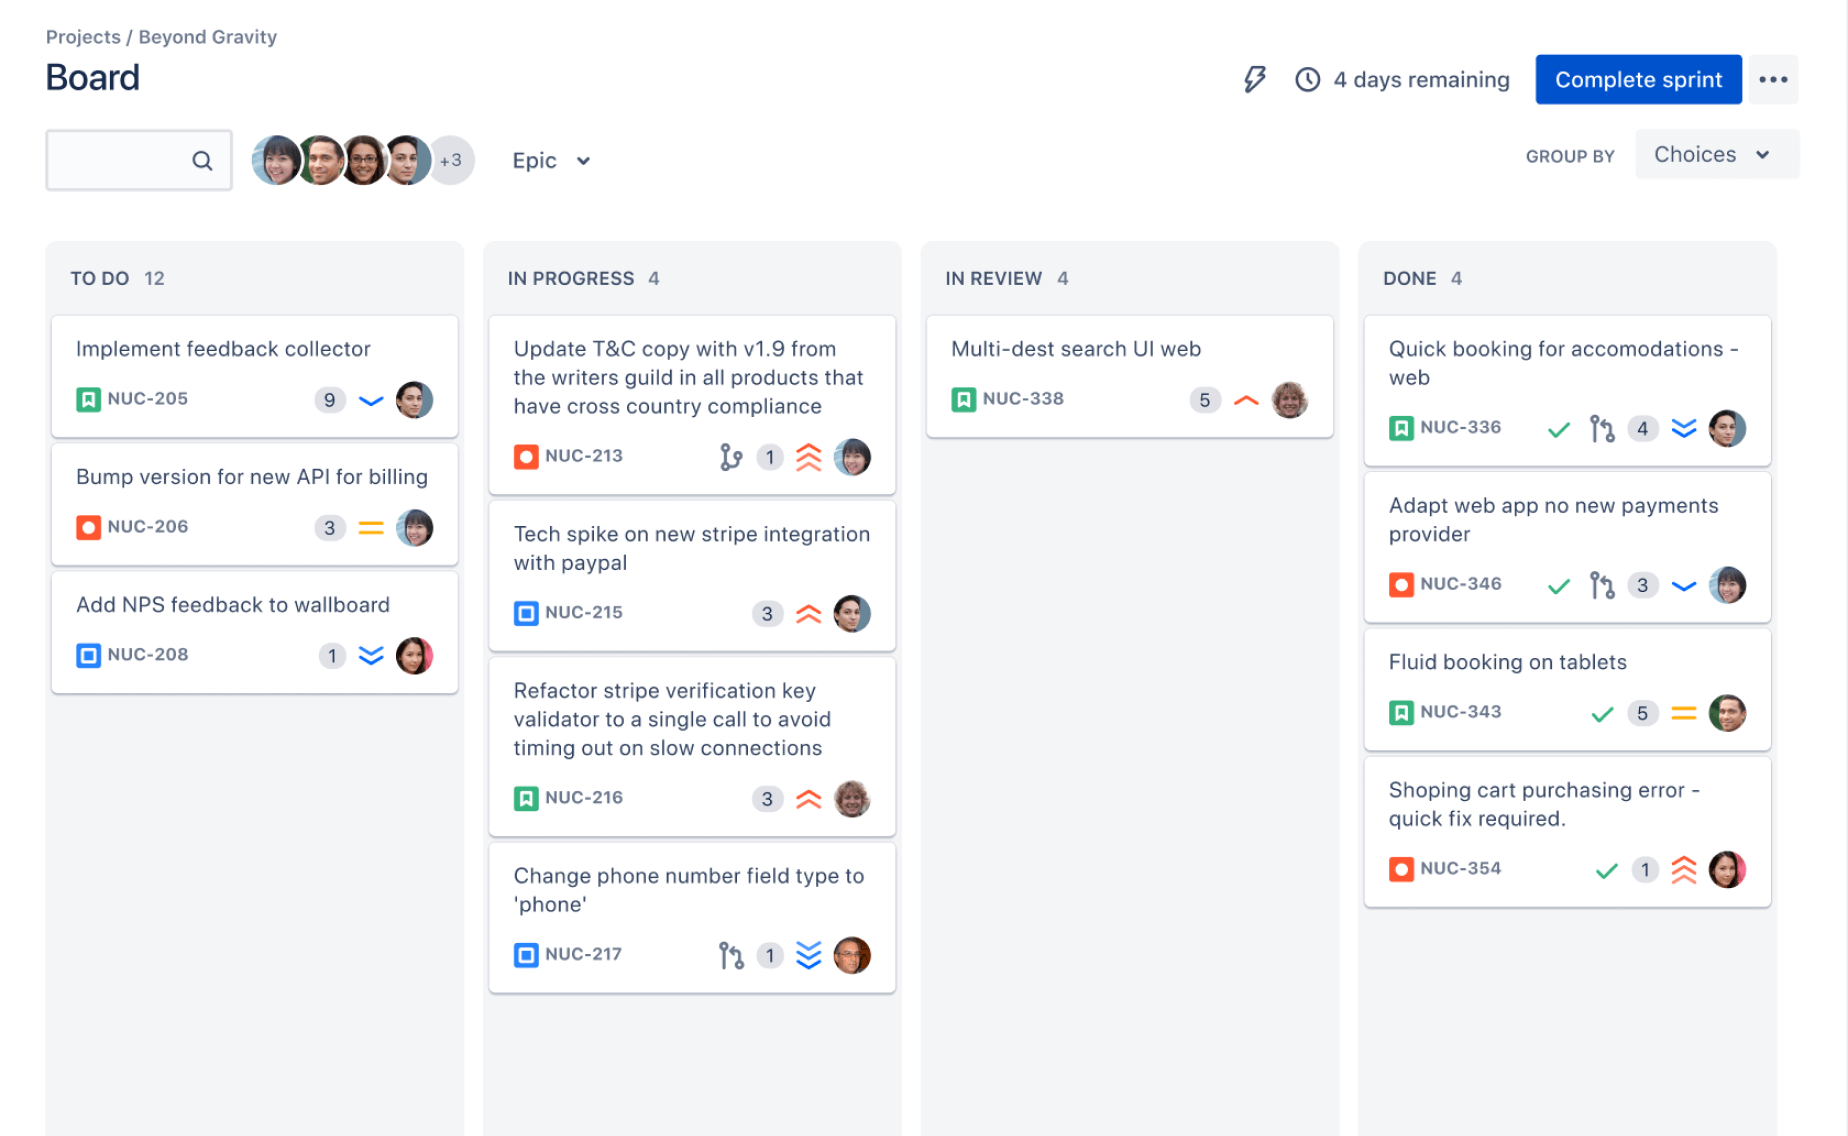
A Jira dashboard is a customizable page that brings project information and reports into one view using gadgets.
Gadgets can display information such as assigned issues, sprint progress, activity, or results from a saved filter. The available options depend on your Jira setup and installed apps.
Think of a dashboard as a project control panel. A team lead might check overdue work before a stand-up, while an executive may want a brief view of milestones and blockers.
Here's why: dashboards are most useful when each gadget answers a practical question. If a chart does not help someone decide what to do next, it may be taking up valuable space.
Start with the audience and its questions
Before adding gadgets, name the people who will use the dashboard and the decisions they need to make. A delivery team might ask, “Which issues are blocked?” A product lead might ask, “Are we on track for the next release?”
Write down a few questions and use them to guide your layout. For example, a team dashboard could show sprint progress, unresolved blockers, and recently updated issues. A leadership view could focus on milestones, workload, and risks.
Choose a useful scope
Decide whether the dashboard should cover one project, several projects, or a specific workflow stage. A narrow scope makes trends easier to interpret. A broad scope can help managers compare work across teams, but it may need clearer filters.
For instance, a support lead could focus on open high-priority issues across several projects. A development team may need a view limited to its active sprint.
Build a dashboard step by step
You can create a helpful dashboard without filling every available space. Start with a small number of views, check whether they answer your questions, and adjust from there.
Create the dashboard. Open the dashboards area in Jira and choose the option to create a dashboard. Add a clear name and description so people can recognize its purpose.
Set access deliberately. Decide whether the dashboard is private or shared with specific people or groups. Keep in mind that dashboard access and access to the filters it displays may be managed separately.
Add a few relevant gadgets. Choose gadgets that match your planned questions, such as a filter results view or a sprint report. The exact selection can vary by Jira edition and installed apps.
Configure each gadget. Select the relevant project, saved filter, time period, or display settings. Use clear labels so viewers can understand what they are seeing.
Arrange the layout. Put the most time-sensitive information near the top. Group related views together, and avoid making people scroll past low-priority details.
Test the view with its audience. Ask a teammate to check whether the dashboard answers its intended questions. Confirm that shared viewers can access the filters and projects they need.
The best part? You can improve the dashboard after people use it. If a gadget is ignored during several reviews, replace it with a more useful view or remove it.
Choose gadgets that make project status clearer
Gadgets turn Jira information into readable views, but more gadgets do not automatically mean more insight. Select each one for a clear purpose, such as finding urgent work or spotting changes in progress.
A filter results gadget can show issues matching criteria you have saved. For example, a team might track unresolved high-priority issues assigned to its members. A sprint-focused view can help the team check progress during planning or a daily stand-up.
Let me explain: a gadget is only as useful as its configuration. If a filter includes closed issues from several years, its results may distract people instead of helping them act.
Match the view to the decision
For a daily team check-in, prioritize blockers, urgent issues, and sprint progress. For a project review, show milestones, work by status, and trends that help explain changes since the previous meeting.
As a concrete example, a team could place a list of blocked issues beside a sprint progress view. That pairing helps people connect a stalled task with the broader delivery picture.
Keep the visual load manageable
Use concise names and familiar categories. If two gadgets answer almost the same question, keep the clearer one. A viewer should be able to scan the page and understand its main message quickly.
Different teams may interpret the same chart in different ways. Include enough context in titles or descriptions to clarify the project, time period, or issue group being shown.
Share dashboards without creating access confusion
A shared dashboard can save time, but sharing the page does not always provide access to every project or saved filter it displays. Check the relevant permissions before announcing a dashboard to a wider group.
For example, a manager may be able to open the dashboard while seeing an empty gadget because its filter is private. Reviewing the dashboard and filter permissions together helps prevent this mismatch.
Set expectations for each audience
Use a short description to explain who the dashboard is for and how often its views are reviewed. If the dashboard supports a weekly review, say so. That gives viewers a reason to return and helps them interpret changes over time.
Keep sensitive project details limited to the people who need them. If several audiences require different levels of detail, separate dashboards may be clearer than one shared page with mixed priorities.
Check the view as a regular viewer
After changing sharing settings, ask someone with the intended access level to open the dashboard. Verify that its gadgets load, labels make sense, and linked views are accessible.
This quick check can catch permission gaps before a meeting. It also reveals whether a dashboard feels clear to someone who did not build it.
Maintain the dashboard as work changes
Projects evolve, and dashboards can become outdated when teams change priorities, workflows, or sprint practices. A brief review every few weeks can help keep the page useful.
Check whether each gadget still answers a current question. Confirm that filters include the right projects and statuses. Remove views that no longer guide a decision, then ask the team what information is missing.
You might be wondering: how do you know whether the dashboard is working? Look for practical signs. Are teammates using it during reviews? Can they find blockers without asking someone to assemble a separate update? Do viewers understand the displayed time period?
For example, if a team repeatedly exports issue lists to discuss overdue work, its dashboard may need a clearer overdue-issues view. The goal is not to eliminate every other report. It is to make recurring project checks easier.
Project views with ONES.com
Value proposition: ONES.com brings project management and knowledge management together, while ONES Project offers project workflows and reporting for teams considering a Jira alternative.
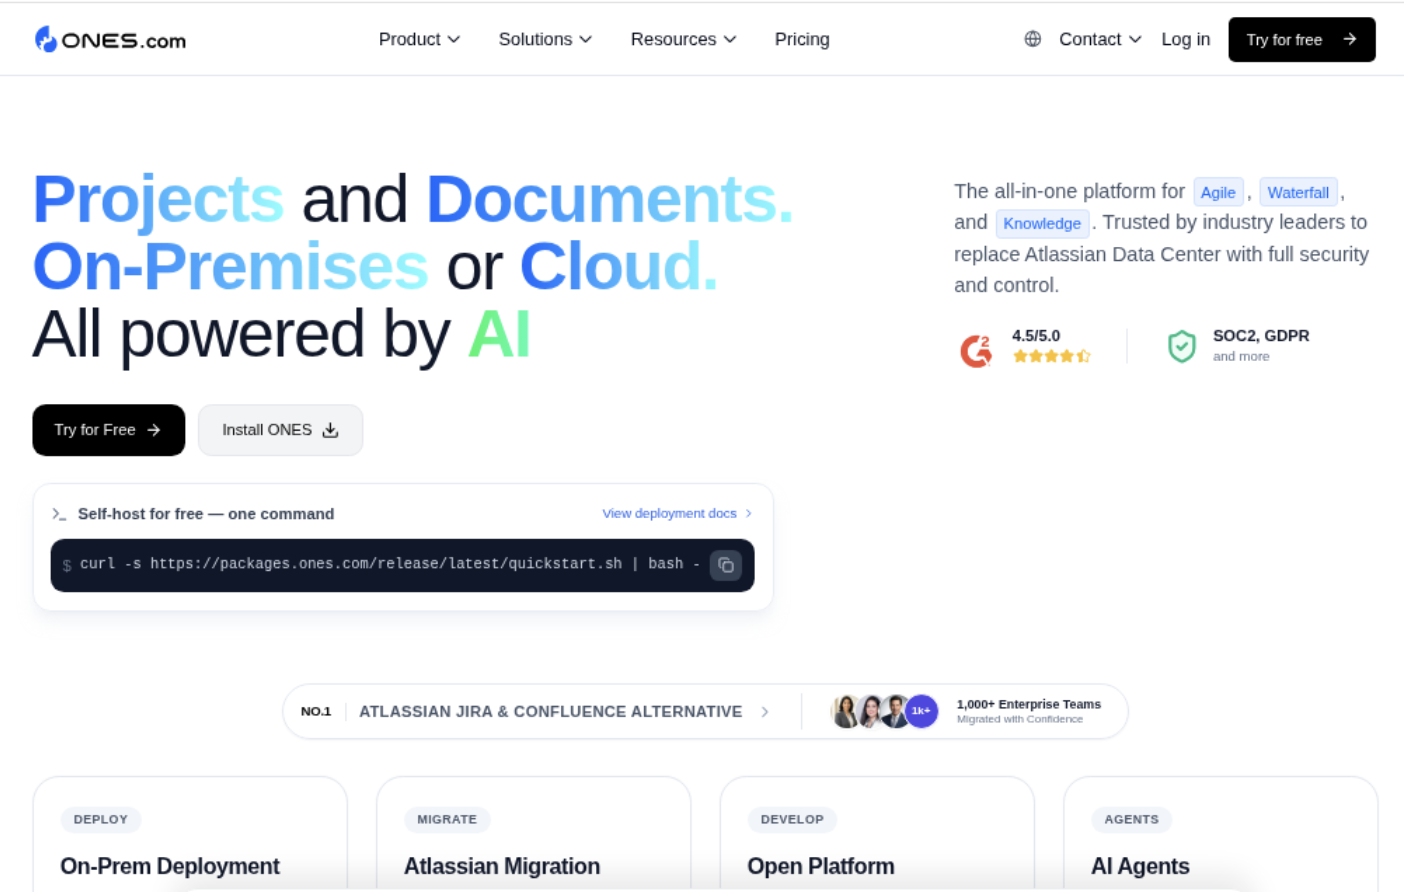
ONES Project and ONES Wiki are sold separately. The platform can suit teams that want project tracking, reporting, and knowledge management within a unified environment.
Core capabilities
Scattered project work: ONES Project supports Jira-compatible workflows, helping teams carry familiar work patterns into a project management platform.
Limited status visibility: Built-in reporting helps teams review project progress without relying on disconnected status checks.
Rigid workflows: Custom workflows let teams shape work stages around their processes, making project status more meaningful.
Inflexible issue details: Custom fields allow teams to capture the details needed for their work and reviews.
Sprint planning overhead: Sprint management supports planning and tracking iterative development work in one project environment.
Repeated manual actions: Automation can handle recurring workflow tasks, reducing routine effort for project teams.
Deployment constraints: Teams can choose Cloud, On-Premise, Private Cloud, or Air-gapped deployment to suit their environment.
Concern about feature gaps: ONES.com offers feature parity between its cloud and self-hosted versions, giving teams flexibility in deployment.
Evaluating before rollout: The free plan supports up to 30 seats, so a team can assess the platform with a defined group.
Application scenarios
A software team reviewing a Jira alternative could use ONES Project to manage sprints, configure workflows, and review built-in reports. This can help the team evaluate whether its work processes fit the platform before expanding adoption.
A team working in a restricted network may need an air-gapped deployment. ONES.com supports that option, alongside On-Premise and Private Cloud deployments. If the team also needs a knowledge base, it can consider ONES Wiki separately.
Common dashboard challenges and practical fixes
Too many gadgets compete for attention
Problem: The dashboard becomes a crowded page that people stop scanning. Important issues get lost among charts that repeat similar information.
Solution: Tie each gadget to a decision or recurring question. Remove redundant views and move the most urgent information to the top.
A gadget appears empty to some viewers
Problem: A dashboard loads, but one or more gadgets show no results. The viewer may lack access to a filter, project, or issue group.
Solution: Check the gadget configuration and related permissions with an account that has the intended viewer access. Confirm that the filter returns issues for that audience.
Numbers do not match expectations
Problem: A count or chart appears inconsistent with what the team expects. Different filters, statuses, or time periods may be included.
Solution: Review the filter criteria and gadget settings. Add context to the title or description so viewers know what the view includes.
The dashboard becomes stale
Problem: A once-useful view reflects old priorities or no longer matches the team’s workflow. People may return to manual updates instead.
Solution: Schedule a short review and ask viewers which gadgets they use. Update the filters and layout when team goals or project stages change.
Frequently asked questions
What should a Jira dashboard include?
Include views that answer the questions your audience asks regularly. A development team might need sprint progress, blocked issues, and urgent work. A project manager may want milestones, workload, and cross-project risks. Start with a few focused gadgets, then adjust after people use the dashboard. The right setup depends on the project, team responsibilities, Jira configuration, and available gadgets.
Can I share a Jira dashboard with other people?
Yes, dashboards can be shared with selected people or groups, depending on your Jira setup and permissions. Check access to the saved filters and projects shown by its gadgets as well. Someone may be able to open the dashboard but still lack permission to view a particular gadget’s results. Test the dashboard with a viewer account before sharing it widely.
Why is a Jira dashboard gadget showing no results?
A gadget may show no results if its filter returns nothing, its settings point to the wrong project, or the viewer lacks access. Check the filter criteria first, including project, status, and time range. Then confirm the gadget settings and permissions. Testing with the same access level as the intended audience can help pinpoint the cause.
How often should I review a project dashboard?
Review it whenever the project’s priorities, workflow, or audience changes. A light check every few weeks can catch outdated filters and unused gadgets. You can also ask teammates during a regular review whether the dashboard helped them make decisions. If people repeatedly seek the same missing update, consider adding a focused view for that question.
Conclusion
A clear Jira dashboard starts with the decisions people need to make. Choose a small number of relevant gadgets, configure filters carefully, and check sharing permissions before inviting others.
Then review the page as the project changes. Remove views that add clutter, improve ones that hide important risks, and ask teammates whether the dashboard helps them act.
When project updates feel scattered, a focused dashboard can make the next step easier to see. Start with one audience, answer its most important questions, and build from there.