Jira Gantt Charts: A Step-by-Step Planning Guide for Teams
Need clearer timelines? Learn how a gantt chart jira connects tasks, dependencies, and deadlines for better team planning. Read now.
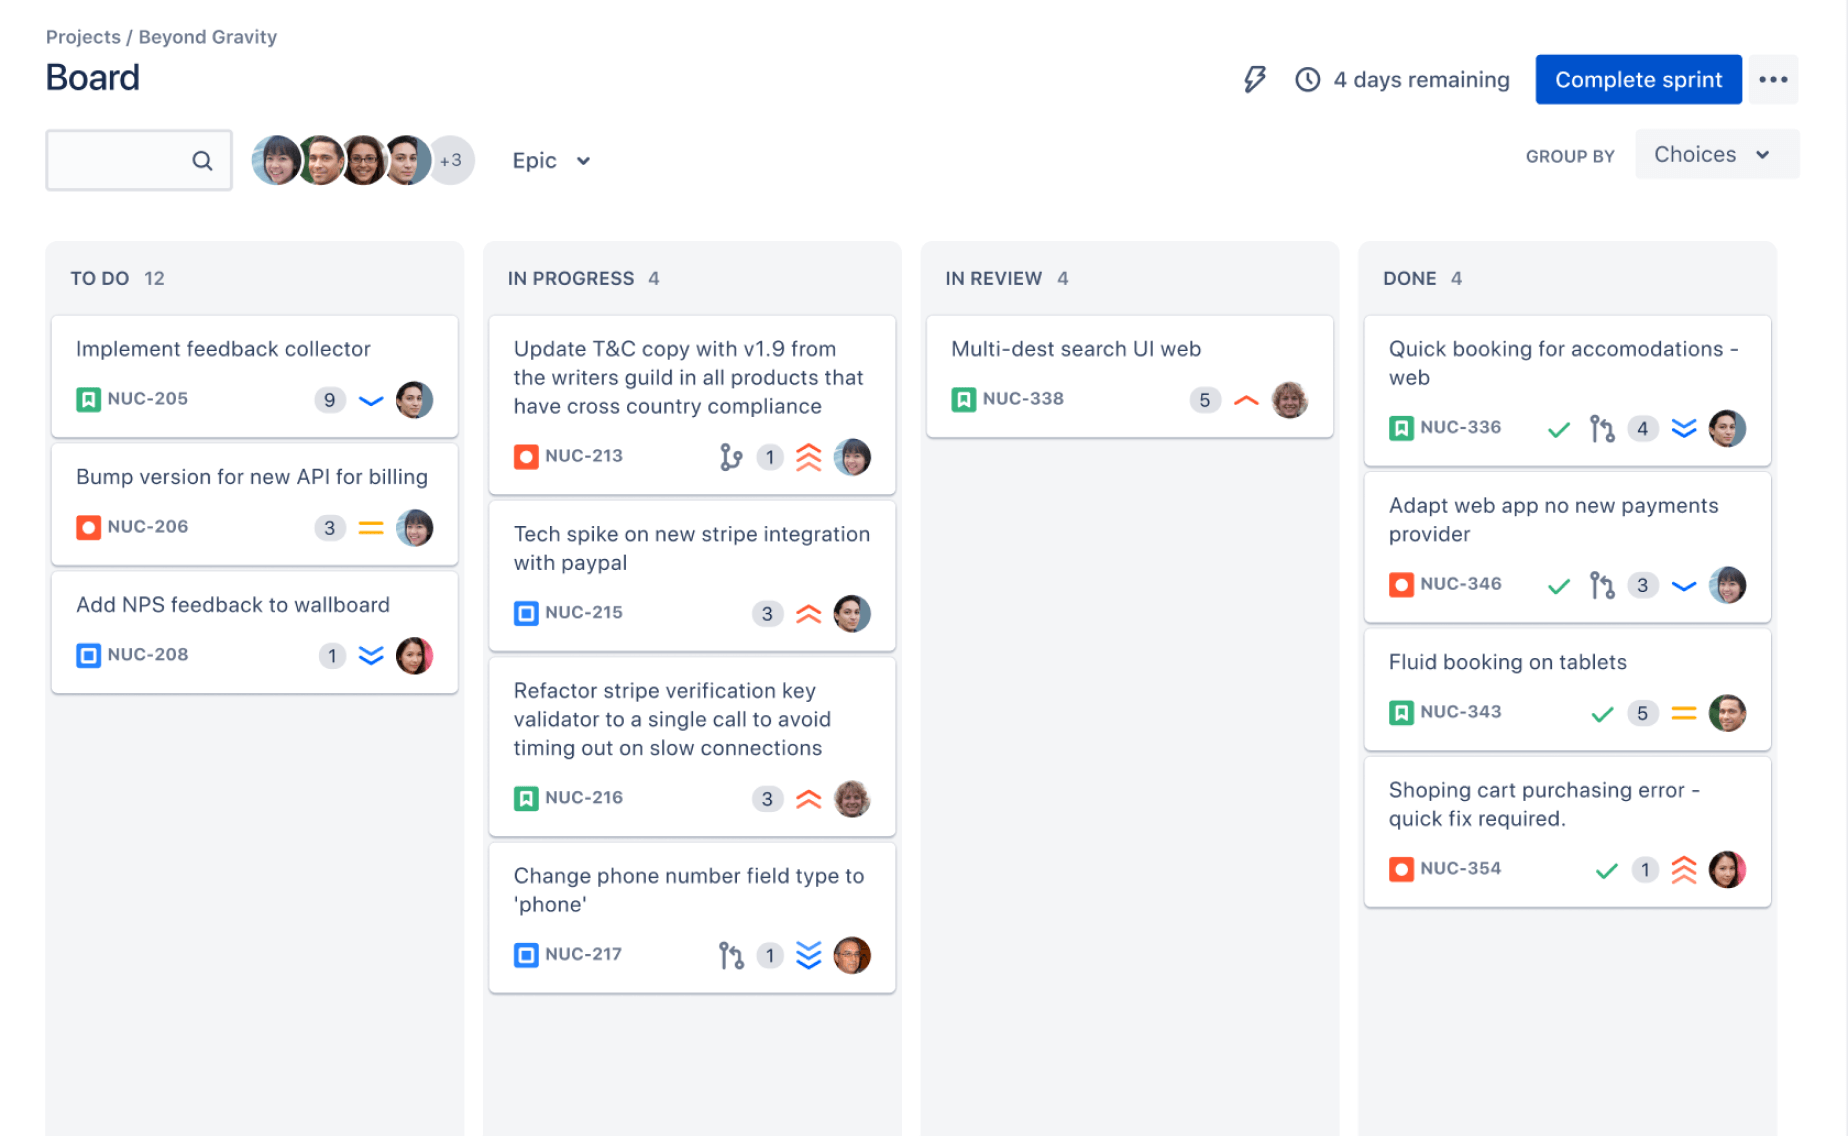
Project plans can look manageable until dependencies collide, deadlines move, and everyone interprets priorities differently. A Jira board shows work clearly, yet it may not reveal how one late task affects the entire release.
That gap creates costly surprises. A developer may start before design is ready, testing may receive work too late, and stakeholders may discover schedule risk during the final week. Teams then spend more time explaining delays than preventing them.
A Gantt chart in Jira can solve this planning problem by placing tasks, durations, dependencies, and milestones on a shared timeline. This guide shows you how to build one, keep it accurate, and use it for practical project decisions.
How to Build a Gantt Chart in Jira
A Jira Gantt chart turns work items into a timeline. You can see when each task starts, when it should finish, which tasks depend on others, and where milestones sit within the delivery plan.
Jira does not always provide every timeline function in the standard issue view. Depending on your Jira edition and configuration, you may need a roadmap feature, an advanced planning view, or a marketplace app.
Step 1: Define the Planning Outcome
Start by deciding what the timeline needs to help you answer. A release plan, product launch, infrastructure migration, and marketing campaign each require different levels of detail.
For example, a product team may need to answer three questions:
- Can development finish before the planned release date?
- Which testing activities depend on completed development work?
- What schedule changes would create the greatest delivery risk?
These questions determine what you include. A team planning a two-week sprint may need task-level detail. A leadership roadmap may only need epics, milestones, and major dependencies.
Step 2: Organize Jira Work Items
Review your Jira hierarchy before creating the timeline. Group related issues under epics, initiatives, releases, or other planning levels available in your setup.
A simple structure might look like this:
- Initiative: Mobile checkout improvement
- Epic: Payment flow redesign
- Story: Add saved payment method
- Task: Update payment API
- Task: Create interface states
- Task: Run payment regression testing
Clear hierarchy prevents the chart from becoming a long list of unrelated tickets. It also lets you switch between a high-level roadmap and detailed execution planning.
Step 3: Add Dates and Duration
Give each important issue a planned start date and due date. A due date alone cannot show how long work takes or whether tasks overlap safely.
Use realistic estimates. If design usually takes three working days, avoid entering one day simply to make the launch appear closer. A misleading timeline creates false confidence.
For example, a feature may follow this schedule:
| Work item |
Planned period |
| Design approval |
April 1–3 |
| Frontend development |
April 4–10 |
| Backend integration |
April 4–8 |
| Quality assurance |
April 11–15 |
| Release preparation |
April 16–17 |
This layout immediately shows that development can overlap with backend integration, while quality assurance must wait for the required work to finish.
Step 4: Link Dependencies
Dependencies show relationships between tasks. The most common relationship is finish-to-start: one task must finish before another can begin.
Examples include:
- Design approval must finish before development begins.
- API integration must finish before end-to-end testing begins.
- Security review must finish before production deployment.
Link only genuine dependencies. If every issue connects to several others, the chart becomes difficult to maintain and small changes create unnecessary schedule movement.
Step 5: Add Milestones
Milestones mark important events rather than extended work. A release date, approval gate, beta launch, or regulatory review can serve as a milestone.
Place milestones where decisions matter. For example, “Design approved” may be more useful than “Design task completed” because it signals that another team can begin work with confidence.
Milestones also help stakeholders scan the plan quickly. Someone reviewing a six-month roadmap can focus on launch dates and approval points before exploring individual issues.
Step 6: Assign Ownership and Capacity
A timeline becomes more useful when every major activity has an owner. Assign ownership to a person, team, or functional group, depending on how your organization works.
Then compare the schedule with available capacity. If one engineer owns five overlapping tasks, the chart may show an impossible plan even when every dependency looks correct.
For example, a testing phase scheduled for five days may require two testers. If only one tester is available, you should extend the duration or reduce the scope before the schedule becomes urgent.
The critical path is the chain of dependent work that controls the earliest possible completion date. A delay on this path can move the final milestone.
Suppose a launch depends on requirements approval, development, security review, and deployment. A two-day delay in an unrelated analytics task may have no effect, while a two-day delay in security review may move the launch immediately.
Highlight critical activities so the team knows where early action matters most.
Step 8: Connect the Timeline to Team Execution
A Gantt chart should stay connected to the work your team performs each day. When an issue changes status, its timeline position should remain easy to update.
During planning meetings, compare the timeline with active Jira work. During weekly reviews, check overdue tasks, changed estimates, blocked items, and upcoming milestones.
Use the chart for decisions rather than decoration. If a task slips, discuss whether to change scope, add capacity, revise dependencies, or move the milestone.
What a Jira Gantt View Should Show
A useful timeline combines schedule information with execution context. At minimum, you should see work items, dates, duration, hierarchy, dependencies, progress, and milestones in one planning view.
Tasks and Hierarchy
Tasks explain the work. Hierarchy explains how that work contributes to a larger outcome.
For example, “Create onboarding flow” may belong to the “New customer experience” epic. This relationship helps you understand whether an epic is progressing evenly or whether one task is holding up the whole outcome.
Dependencies and Relationship Types
Dependencies explain sequence. Some tools support additional relationships, such as start-to-start or finish-to-finish links, when work can overlap in more complex ways.
Use these relationships carefully. A product manager and technical writer may begin together, while final publishing still depends on approved product terminology.
Progress and Schedule Variance
Progress indicators help you compare planned work with actual movement. A task marked 80 percent complete may still threaten the schedule if its remaining work includes the most difficult step.
Schedule variance gives you an early warning. If an activity planned for three days reaches day five, review the cause before the delay spreads to dependent work.
Milestones and Release Markers
Milestones make the timeline readable for people who do not need every issue. Use clear names such as “Beta release,” “Security approval,” or “Production launch.”
Place release markers beside the work required to reach them. This creates a direct connection between a date and the activities supporting it.
Jira Gantt Charts Compared With Boards and Roadmaps
A board, roadmap, and Gantt chart answer different planning questions. A board shows current flow, a roadmap shows direction across time, and a Gantt chart shows duration and dependency relationships.
| Planning view |
Best question it answers |
| Kanban board |
What is being worked on now? |
| Sprint board |
What should the team complete in this iteration? |
| Roadmap |
What outcomes are planned across upcoming periods? |
| Gantt chart |
How do duration and dependencies affect delivery dates? |
Here’s why the distinction matters: a board may show that testing is in progress, while a Gantt view shows that testing started two days late and now overlaps with a fixed launch milestone.
You do not need to choose one view for every situation. A delivery team can use a board for daily execution and a timeline for release planning. Leaders can use a roadmap for broader communication.
How to Keep the Timeline Accurate
The biggest planning mistake is treating the chart as a one-time setup. A timeline loses value when dates remain unchanged after scope, capacity, or dependencies shift.
Set a Review Rhythm
Review the plan during weekly delivery meetings or at a frequency that matches project risk. High-change projects may need two reviews each week.
Check four areas:
- Tasks that passed their planned finish date
- Dependencies that became blocked
- Milestones approaching within the next two weeks
- Work that changed scope or estimate
Separate Planned and Actual Progress
Planned dates describe expectations. Actual progress describes what happened. Keeping both perspectives helps you identify recurring estimation or capacity problems.
For example, if integration repeatedly takes twice as long as planned, the next schedule should reflect that pattern. The goal is better forecasting rather than optimistic reporting.
Use Baselines When Available
A baseline preserves an earlier plan so you can compare it with the current schedule. This makes schedule movement visible after a release date changes.
Imagine that a launch was originally planned for June 10 and later moves to June 17. A baseline helps you see whether the change came from added scope, delayed approval, reduced capacity, or a dependency outside the team.
Keep Detail at the Right Level
Too little detail hides risk. Too much detail makes maintenance exhausting.
A practical approach is to use detailed tasks for near-term work and broader milestones for distant planning. As a release approaches, break large items into smaller activities.
Common Mistakes When Planning With a Jira Timeline
Adding Dates Without Dependencies
Dates alone create a calendar. Dependencies create a model of how work moves.
If development and testing have dates but no relationship, a schedule change may leave testing in the wrong position. Link activities that genuinely control one another.
Planning Every Task at the Same Detail
A six-month plan with thousands of small tasks becomes difficult to read. A two-week plan with only broad epics may hide daily risks.
Match detail to planning distance. Keep long-range work broad, then add precision as execution gets closer.
Ignoring Team Capacity
A timeline can look logical while assigning more work than a team can complete. Always check overlapping assignments and specialist constraints.
For example, one security engineer may support several teams. Scheduling four security reviews during the same week creates a bottleneck even when each project has a reasonable duration.
Changing Dates Instead of Investigating Causes
Moving a due date can make the chart appear current, yet it does not explain why work slipped. Record the reason and decide whether the plan needs additional capacity, reduced scope, or a different sequence.
Leaving Stakeholders Out of Schedule Reviews
Stakeholders may control approvals, launch communications, compliance checks, or external commitments. Invite the right people when a dependency affects their responsibilities.
A short review with the release manager can prevent a team from planning technical completion after a fixed customer announcement.
Gantt Chart Solution: ONES.com

Value Proposition
ONES.com combines project management and knowledge management in one platform. ONES Project provides Jira-compatible workflows, timeline planning, and delivery controls for teams that need clearer scheduling with fewer disconnected tools.
ONES Project is sold separately from ONES Wiki, which provides knowledge management capabilities similar to a Confluence alternative.
Core Capabilities
- Scattered planning views → Unified project planning: ONES Project brings tasks, schedules, dependencies, and progress into a connected workspace, helping teams review delivery in one place.
- Rigid issue structures → Custom workflows and fields: Teams can adapt statuses, fields, and approval stages to match their planning process, reducing workarounds.
- Unclear dependency impact → Timeline relationships: Teams can connect related work and see how schedule movement affects downstream activities.
- Separate reporting effort → Built-in reporting: Built-in reporting helps teams review progress, overdue work, workload, and delivery trends without assembling separate views.
- Manual sprint coordination → Sprint management: Sprint planning and execution features help teams align iteration goals with larger release timelines.
- Repetitive updates → Automation: Automation can handle recurring status changes, notifications, and workflow actions, reducing routine coordination.
- Migration concerns → Jira-compatible workflows: Teams familiar with Jira can preserve familiar project patterns while evaluating a Jira alternative.
- Deployment restrictions → Flexible deployment options: ONES.com supports Cloud, On-Premise, Private Cloud, and Air-gapped deployments, giving organizations more control over hosting.
- Different environments → Feature parity: The cloud and self-hosted versions provide full feature parity, helping teams choose an operating model without giving up core capabilities.
- Limited initial access → Free plan for 30 seats: A team can begin evaluating the platform with up to 30 seats before deciding whether its planning workflow fits broader adoption.
Application Scenarios
Software release planning: A development team can connect epics, stories, sprint work, testing, and release milestones. When a dependency slips, the team can inspect the affected schedule and decide whether to adjust scope or timing.
Regulated delivery: A team working in a restricted environment may choose an On-Premise or Air-gapped deployment. Its project schedule, approvals, and workflow controls can remain within the required operating model.
Cross-functional launches: Product, engineering, design, and marketing can coordinate milestone dates through project planning while maintaining related guidance in ONES Wiki. Since ONES Project and ONES Wiki are sold separately, teams can select the capability they need.
Common Challenges and Practical Solutions
Challenge: Dates Keep Moving
Solution: Review the reason behind each change. Separate scope growth from estimation error, capacity limits, approval delays, and external dependencies.
Challenge: The Timeline Contains Too Much Detail
Solution: Show epics and milestones for leadership reviews. Keep task-level detail for the delivery team and near-term planning.
Challenge: Dependencies Become Outdated
Solution: Review links whenever scope changes. Remove relationships that no longer control sequence, then add new connections when work is split or reordered.
Challenge: Teams Disagree About Completion
Solution: Define completion criteria before scheduling. For example, consider an integration complete only after implementation, review, automated checks, and a successful test environment run.
Challenge: The Chart Is Updated by One Person
Solution: Give responsibility for schedule updates to the people closest to the work. A project manager can govern the process while specialists maintain estimates and progress.
FAQs
Can Jira create a Gantt chart?
Jira can support timeline-style planning through available roadmap and planning features, depending on your edition and configuration. Many teams also use a marketplace app when they need advanced dependencies, baselines, critical-path analysis, or detailed scheduling. Before choosing an approach, check which features your Jira setup already includes and compare them with the planning depth your team requires.
What should a Jira Gantt chart include?
Include work items, hierarchy, start dates, due dates, duration, dependencies, milestones, ownership, and progress. Add capacity information when several activities compete for the same specialist. For a release plan, connect the final milestone to the work required for development, testing, approval, and deployment.
How often should you update the timeline?
Review it at least weekly for active projects. High-risk or fast-changing work may need more frequent checks. Update the chart when scope, estimates, dependencies, ownership, or milestone dates change. A timeline that reflects current conditions helps you make decisions before a small delay becomes a release problem.
Is a Gantt chart better than a Jira board?
Each view serves a different purpose. A board is useful for daily flow, work-in-progress limits, and sprint execution. A Gantt chart is useful for duration, sequence, dependencies, and milestone forecasting. Many teams use both: the board manages daily activity, while the timeline explains how that activity affects the wider delivery plan.
How do you prevent a Gantt chart from becoming complicated?
Limit the chart to information that supports a decision. Use hierarchy to group related work, show critical dependencies, and avoid adding links that do not affect sequence. Keep distant planning at a broad level, then add task detail as the work approaches. Regular cleanup also removes completed or irrelevant relationships.
Conclusion
A Gantt chart in Jira helps you connect tasks with time, dependencies, capacity, and milestones. The strongest plans begin with a clear outcome, use realistic dates, link genuine dependencies, and receive regular updates.
But here’s the truth: a timeline cannot repair unclear ownership or unrealistic scope by itself. It reveals those problems early, giving you time to adjust the plan before the final deadline is at risk.
If Jira’s standard planning views do not provide enough depth, evaluate a dedicated Jira alternative such as ONES Project. With suitable timeline controls, workflows, reporting, deployment options, and sprint management, you can build a planning process that stays useful from the first estimate through delivery.