Jira Time in Status: A 2026 Step-by-Step Tracking Guide
Wondering where Jira issues stall? Track jira time in status step by step to uncover delays and improve team flow. Read now to learn how.
A Jira issue can sit in “In Progress” for days while your team assumes it is moving normally. When a release slips, you need to know where the delay happened—not just how long the issue stayed open.
Jira’s built-in reports can help you understand team flow, but they do not always show the time each issue spent in every status. That gap makes it harder to spot a slow review queue or explain a long handoff.
Here’s the truth: you can start tracking Jira time in status with Jira’s reports and issue history, then add more detailed tracking if your team needs it. I’ll show you how to choose the right view, read the results, and avoid common measurement mistakes.
How to Track Time in Status in Jira
Time in status is the elapsed time an issue spends in a particular workflow status, such as “To Do,” “In Review,” or “Done.” You can inspect transitions in an issue’s history, use Jira reports to understand workflow trends, or use a specialized app for detailed per-status metrics.
Use these steps to select a method and make the results useful:
Decide what you want to measure. Choose whether you need an individual issue’s status history, average time across a team, or a detailed breakdown for each workflow stage. For example, a delivery lead might want to compare review time across a sprint, while a support manager may need to investigate one delayed request.
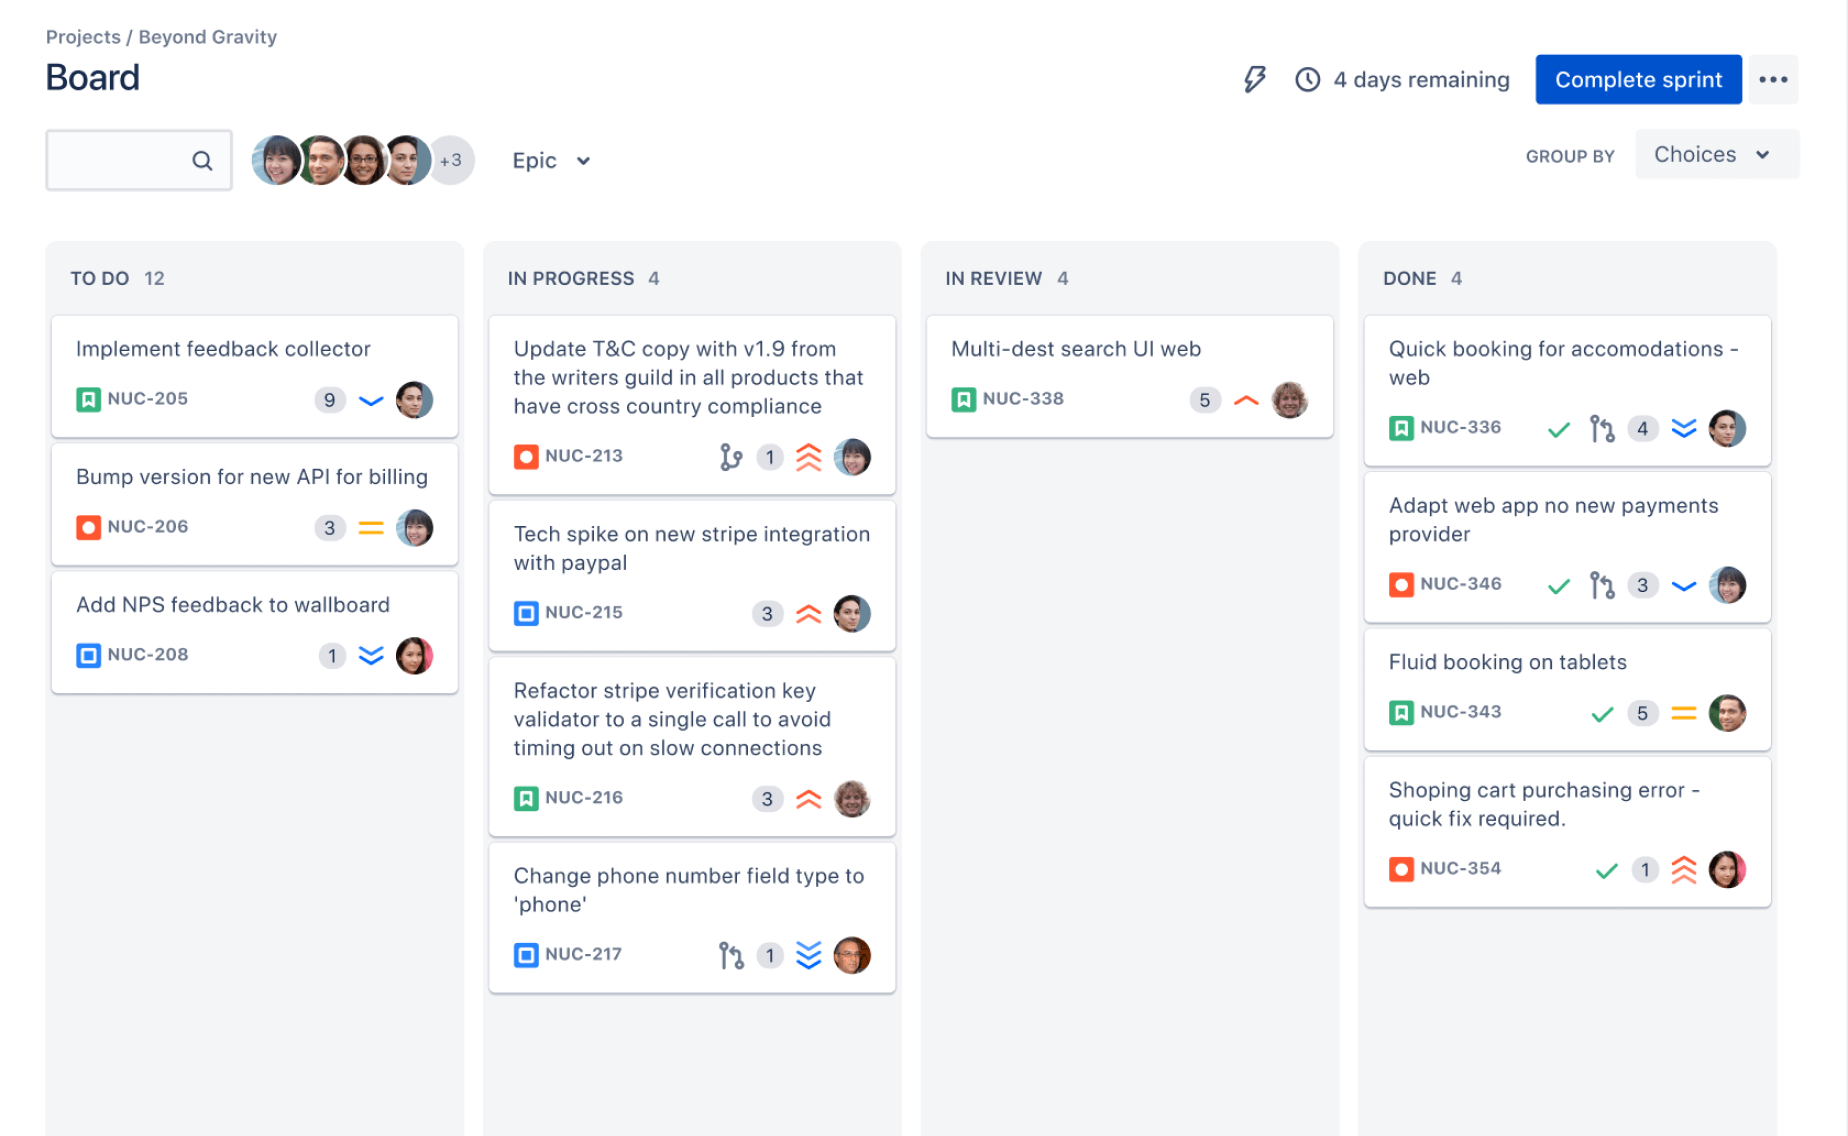
Confirm your workflow and statuses. Check the board columns and workflow statuses your team actually uses. A column can group several statuses, so a report organized by columns may not reveal the time spent in each underlying status.
Check the issue’s history for a specific case. Open an issue and review its activity or history to see when status transitions occurred. This is useful for a one-off investigation, such as finding when a task entered “Waiting for Approval.” You may need to calculate the time between transitions yourself.
Use Jira’s built-in reports for workflow trends. Open the project’s reports and review options such as the Control Chart or Cumulative Flow Diagram, where available. The Control Chart helps assess cycle time for completed work; the Cumulative Flow Diagram can reveal growing queues. These views help diagnose flow, but they are not necessarily a per-issue breakdown of time in every status.
Add granular tracking if the built-in views are not enough. If you need exact time per status across many issues, evaluate a Jira app or a carefully designed automation setup. Check whether it supports your Jira deployment, workflow, working calendar, and reporting needs before relying on its figures.
Set a consistent time policy and review a sample. Decide whether to count calendar hours or working hours, and whether weekends and holidays count. Compare a few reported durations with the issue history. If an issue entered “In Review” Friday afternoon and left Monday morning, your policy determines how that interval is counted.
The best part? You do not need a complex dashboard to begin. Start with one workflow question, such as “Are reviews taking longer this month?” Then choose the Jira view that can answer it reliably.
What Jira Time-in-Status Metrics Can Tell You
Time in status is different from total cycle time. Cycle time usually measures the period between agreed start and finish points, while time-in-status tracking breaks a workflow into stages. For example, a task might spend two days in development, one day in review, and three days waiting for approval.
That breakdown can show where work is waiting. If issues regularly move through development quickly but stay in review, the team may need clearer review ownership or smaller batches. If the longest delay happens before work begins, prioritization or intake may be the bigger concern.
But here's the truth: a long status duration does not automatically mean someone is working slowly. “Blocked” may represent an external dependency, and “Waiting for Customer” may be outside your team’s control. Pair duration with status meaning and issue context before drawing conclusions.
Choose the Right Tracking Method for Your Team
Jira’s built-in reports are a good starting point when you want to understand overall flow. The Control Chart can help you see cycle-time variation, while the Cumulative Flow Diagram can make bottlenecks and growing queues easier to notice.
For one issue, its history can show the sequence and timing of transitions. For a repeated report—such as average time in “QA” across several projects—you may need a Jira app or a tailored automation approach that records each transition consistently.
Let me explain: these options answer different questions. A trend chart can show that delivery slowed, while a per-status report can help explain whether review, testing, or approval contributed to the change.
Set Up Measurements That Reflect Real Work
Write down the exact start and end points before comparing results. A team measuring from “Selected for Development” to “Done” will get a different cycle-time figure from one measuring “In Progress” to “Done.”
Also decide how to handle reopened issues, pauses, and non-working hours. Imagine a bug enters “In Progress,” moves to “Blocked,” and returns to active work two days later. Your team should agree whether the blocked period remains part of the total or gets reported separately.
You might be wondering: should you count calendar time or business time? Neither choice is universally right. Calendar time can suit customer wait-time reporting, while working hours may better reflect a team’s capacity. Keep the rule consistent when comparing periods.
Read Results Without Misjudging Performance
Look for patterns across several issues instead of reacting to one unusually long task. A few delayed reviews may reflect vacations or an urgent incident; a recurring queue is more likely to need a workflow change.
Use the metric to improve the process, not to rank people. For example, if “Ready for QA” issues wait two days on average, you could review testing capacity, handoff details, or how work is prioritized.
Compare similar work and time periods. A small maintenance task and a cross-team feature rarely have the same natural duration, so combining them can make the average misleading.
Time-in-Status Solution: ONES.com
Value Proposition
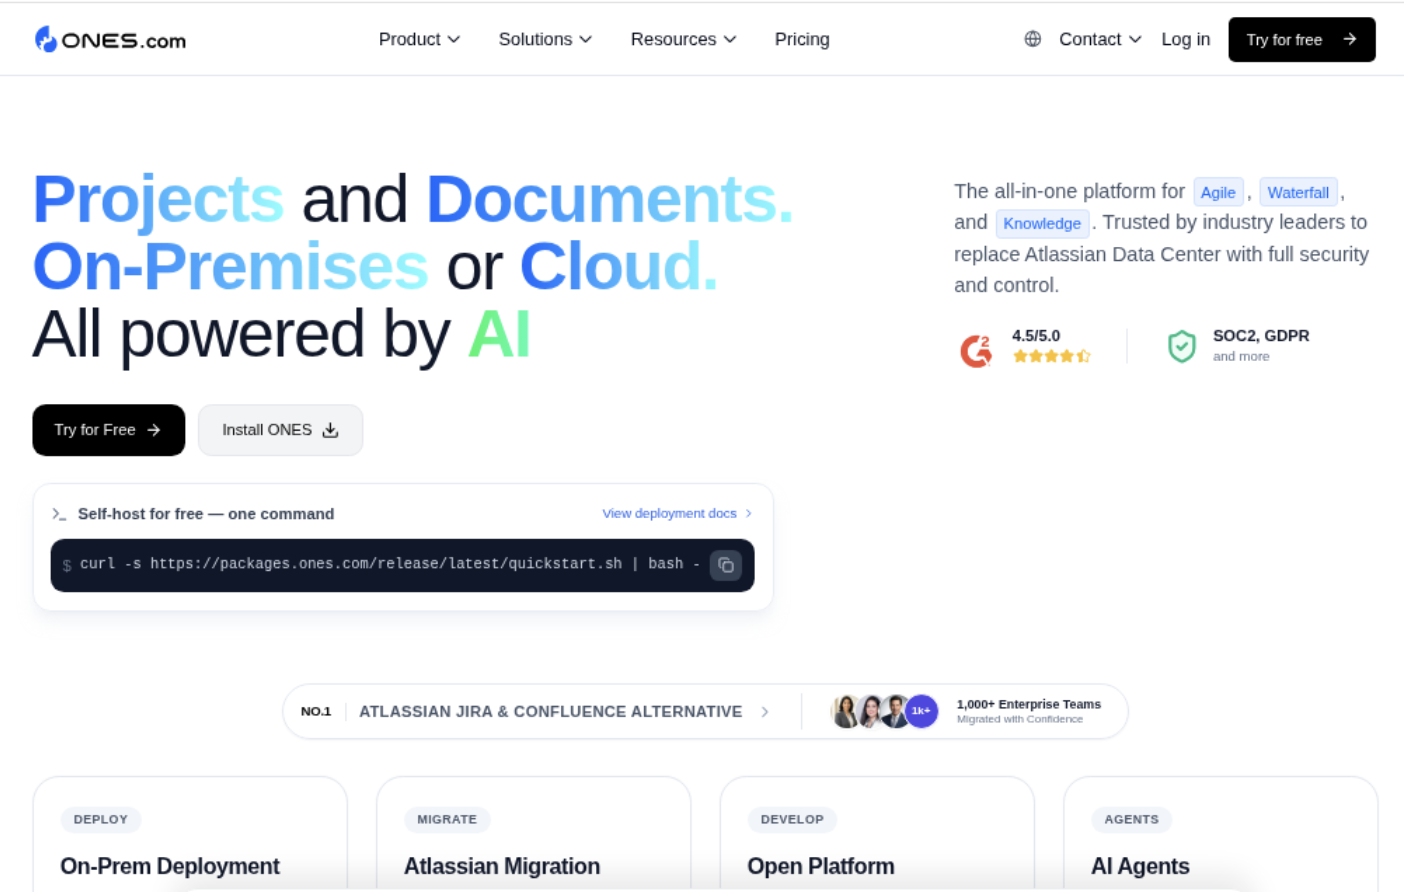
ONES.com brings project management and knowledge management together in one platform powered by ONES Assistant. ONES Project is the project management product and a Jira alternative; ONES Wiki is the knowledge base product and a Confluence alternative. They are sold separately.
For teams reviewing workflow performance, ONES Project offers Jira-compatible workflows, built-in reporting, and options for custom fields and automation. Confirm that its reporting setup matches your exact time-in-status requirements before changing platforms.
Core Capabilities
Pain: Your team needs a familiar workflow. ONES capability: Jira-compatible workflows in ONES Project. Result: Teams can map familiar issue stages and transitions while evaluating a Jira alternative.
Pain: A standard workflow does not match your handoffs. ONES capability: Custom workflows and fields. Result: You can represent stages and issue details that reflect how work actually moves.
Pain: A team needs visibility into delivery progress. ONES capability: Built-in reporting. Result: Project leads can review work progress without treating individual status duration as the only performance measure.
Pain: Sprint work is difficult to coordinate. ONES capability: Sprint management. Result: Teams can organize planned work and review progress within a sprint cycle.
Pain: Repeated handoffs require manual updates. ONES capability: Automation. Result: Teams can reduce routine workflow steps and create more consistent transitions.
Pain: A team relies on several add-ons for common project work. ONES capability: Native project management features, including reporting and custom workflows. Result: You can assess whether fewer plugins meet your requirements.
Pain: A deployment must stay within a controlled environment. ONES capability: Cloud, On-Premise, Private Cloud, and Air-gapped deployment options. Result: You can evaluate a setup that fits your organization’s hosting and security needs.
ONES.com offers a free plan for up to 30 seats. Its cloud and self-hosted versions have full feature parity, which can help teams assess deployment preferences without giving up feature access.
Application Scenarios
A team moving from Jira: A project team can compare its existing issue types, statuses, fields, and sprint routine with ONES Project. It should test a representative workflow and verify how the reports answer its specific duration questions before migrating active work.
A restricted-network organization: A company that cannot use a public cloud service can evaluate On-Premise, Private Cloud, or Air-gapped deployment options. Its project and IT teams can check required workflows, reporting, and integrations in a controlled trial.
A team coordinating project work and internal guidance: A team can consider ONES Project for project management and ONES Wiki for knowledge management. Since the products are sold separately, it can assess each product against its own needs.
Common Challenges and Practical Fixes
Challenge: A board column contains several statuses. This can hide time spent in a specific stage. Fix: Check the workflow status definitions and use a report or tracking method that can distinguish the stages you need to compare.
Challenge: Calendar time and working time are mixed. A weekend can inflate one measure but not another. Fix: State the time policy beside the report and apply it consistently across teams and review periods.
Challenge: Teams treat every long duration as a performance issue. External dependencies, customer waits, and blocked work can lengthen a status. Fix: Review issue context and status meaning before deciding what process change to make.
Challenge: A report’s numbers do not match a team’s expectations. Different start points, reopened issues, or status transitions can change results. Fix: Validate a small sample against issue history, then document the measurement rules.
FAQs
Does Jira show time in status by default?
Jira provides issue history and built-in reports that help you inspect workflow changes and delivery trends. However, a detailed report showing the duration of every issue in every individual status may require an app or a custom tracking approach. Check the reporting options available in your Jira environment and confirm they answer your exact question before setting team targets.
What is the difference between time in status and cycle time?
Cycle time measures the duration between defined workflow points, such as starting active work and completing it. Time in status divides that period into specific stages, such as development, review, and testing. A task with a five-day cycle time might spend two days in development and three days waiting for review. Teams should define their measurement boundaries before comparing figures.
Can I calculate time in status manually in Jira?
For an individual issue, you can inspect its history and calculate intervals between status transitions. This works for occasional investigations, but it becomes tedious across many issues. If you need recurring summaries, consider a report or tracking approach that records transitions consistently, and validate a sample against the issue history.
Should Jira time in status use business hours or calendar hours?
Choose the measure that fits the question. Calendar hours can show how long a customer or dependency waited, including weekends. Business hours can better reflect time during which a team is expected to work. Neither measure is automatically more accurate; the important part is documenting the rule and applying it consistently to every comparison.
Conclusion
Jira time-in-status tracking helps you see where work waits, but the right method depends on the question. Use issue history for individual investigations and Jira reports for broader workflow patterns. For detailed per-status analysis, confirm that your chosen app or automation captures the stages and time rules your team needs.
Start with one real bottleneck, check a handful of issues, and agree on how to count weekends, pauses, and reopened work. That simple discipline can turn a confusing duration into a useful conversation about improving flow.