Jira Velocity Charts: A 5-Step Guide to Sprint Forecasts
Struggling to avoid overcommitting? Use a Jira velocity chart to forecast realistic sprint work from past results. Read now to plan with confidence.
A Jira velocity chart shows how much work your team committed to and completed in past sprints. You can use those results to estimate a realistic range for upcoming sprint work.
Forecasting gets tricky when estimates shift, work carries over, or someone treats one unusually productive sprint as the new normal. That can leave your team overcommitted and stakeholders surprised when planned work slips.
But here's the truth: the chart is useful when you read its limits as carefully as its bars. Here's why: a consistent history gives you a practical planning signal, not a promise. In this guide, I’ll walk you through five steps to find the chart, check its figures, calculate a forecast, and use that forecast responsibly. You’ll also learn what to do when the chart shows a pattern your team didn’t expect.
How to Use a Jira Velocity Chart for Sprint Forecasts
Use the chart to compare completed work across recent sprints, then forecast a range rather than a fixed commitment. These five steps help you turn the report into a planning aid.
-
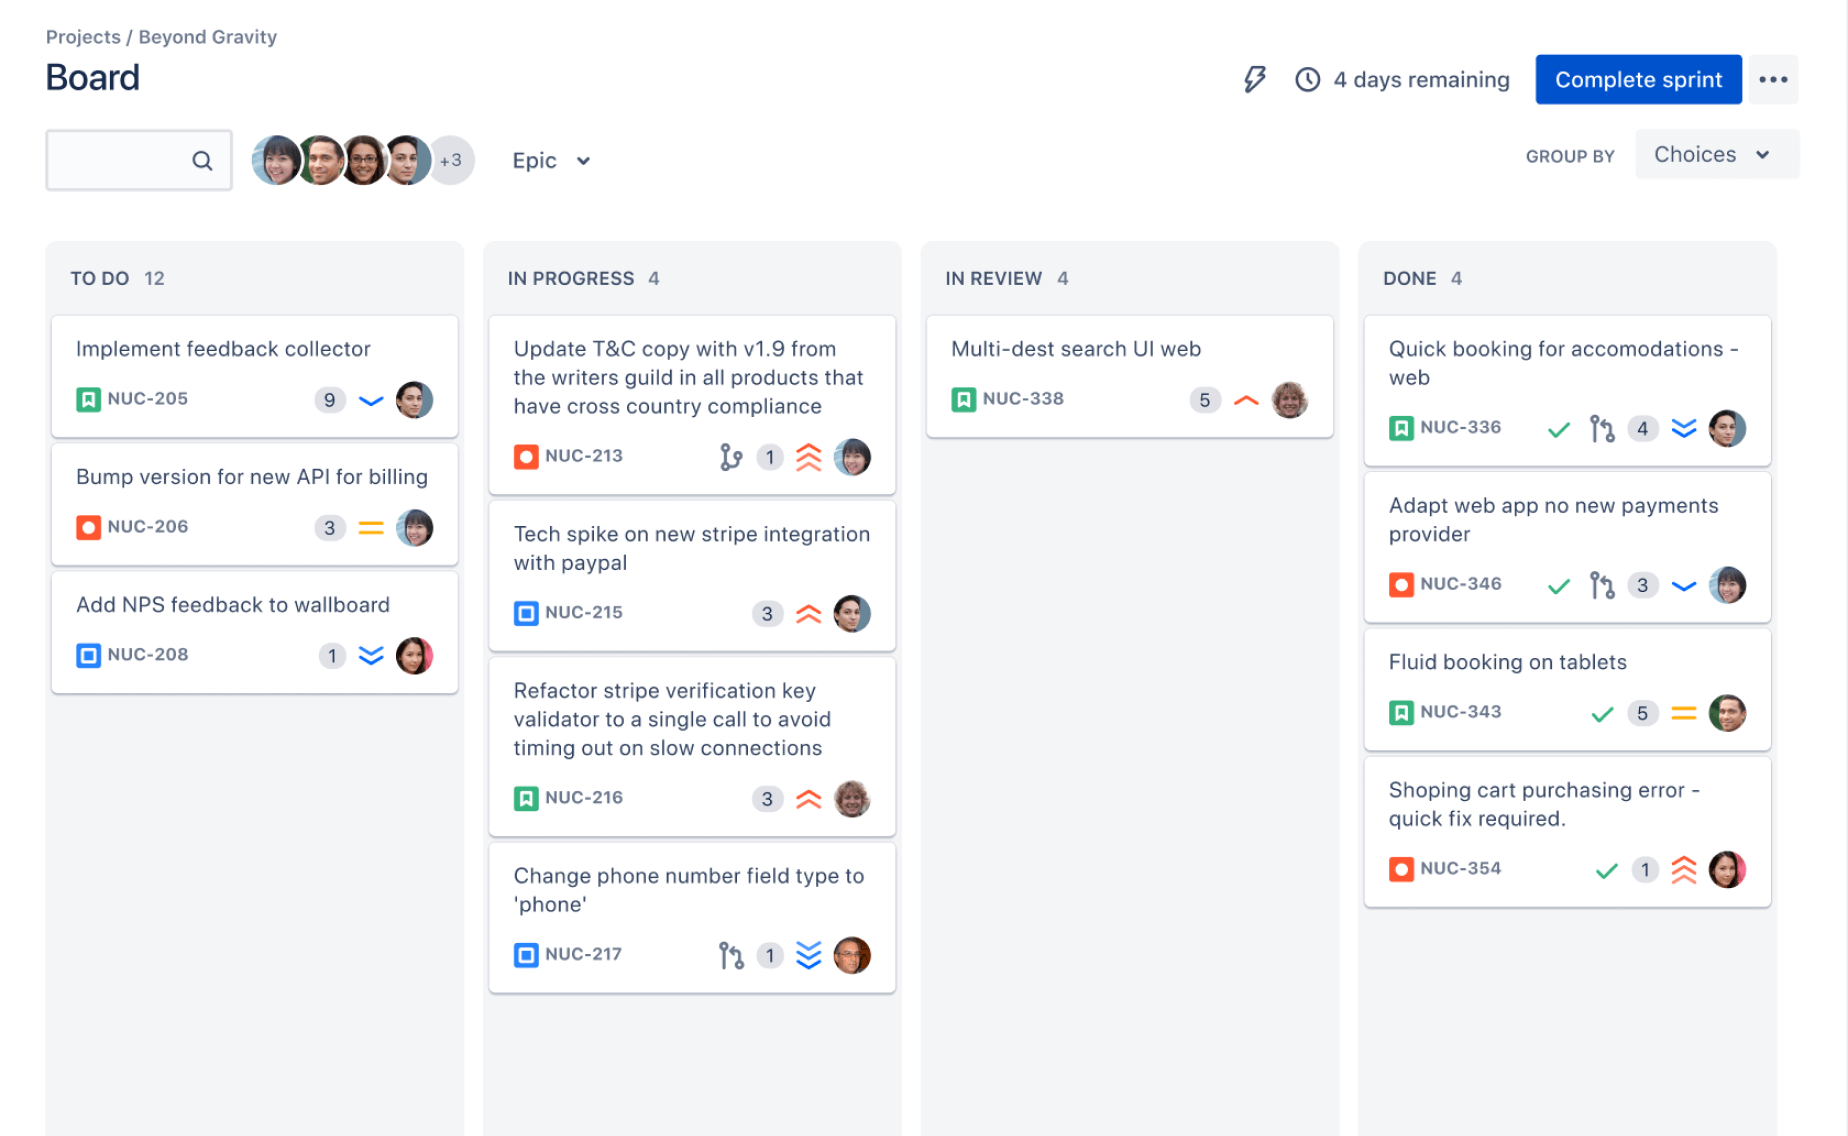
Open the velocity report for your Scrum board
In Jira, open the relevant Scrum board and choose Reports, then select Velocity Chart. The exact navigation can vary slightly with your Jira version and board setup.
Check that you’re looking at the board whose team and sprint history you want to forecast. A chart for a different board can reflect another team’s workflow, estimation habits, or backlog.
-
Confirm the estimation method
Check which estimation statistic the board uses, such as story points or time estimates. The chart’s figures are meaningful only when the team estimates work consistently.
For example, if your team estimates in story points, a sprint with 32 completed points can be compared with another sprint using the same practice. Don’t compare those points with a team estimating in hours.
-
Review completed work and commitment
For each sprint, compare the work committed at the start with the work completed by the sprint’s end. Jira’s chart commonly presents these as separate bars, though the display can differ by version.
Look for repeated patterns, such as the team completing less than its initial commitment or delivering a similar amount several sprints in a row. One bar is a clue; a sequence is more useful.
-
Choose a useful historical window
Review several recent, representative sprints. Three to five can provide a practical starting point, but include more if the team’s work varies widely or its history is short.
Set aside sprints affected by unusual circumstances only when you can explain why they differ. A major absence or a service incident may make a sprint less representative, while ordinary interruptions are part of the team’s operating reality.
-
Turn the history into a forecast range
Calculate the average completed work across your selected sprints, then compare it with the lowest and highest results. Use the range to discuss likely scope and uncertainty.
For example, imagine a team completed 24, 28, 30, and 34 points over four representative sprints. Its average is 29 points, while the observed range is 24 to 34. That history supports a conversation about a roughly 29-point plan, not a guaranteed delivery number.
Before setting sprint scope, discuss known absences, support work, dependencies, and changes in team capacity. A forecast is strongest when it reflects both the chart and the conditions ahead.
What the Chart Shows—and What It Cannot Tell You
A velocity chart gives you a view of completed work over time, often alongside the amount committed at the beginning of each sprint. It helps answer a practical question: how much work has this team recently finished under its usual conditions?
It does not tell you whether an individual story was valuable, whether the estimates are accurate, or whether the next sprint will unfold like the last one. Think of it as a speedometer for recent team delivery, not a guarantee about the road ahead.
Read the gap between commitment and completion
If committed work repeatedly exceeds completed work, investigate the reason before lowering or raising estimates. The gap could reflect unfinished stories, unplanned tasks, dependencies, or changes in sprint scope.
For example, a team might commit to 30 points and finish 22. If four points of urgent support work entered after planning, the chart may not tell the whole story unless the team reviews that interruption alongside the sprint.
Look for a pattern, not a perfect line
Velocity often rises and falls. A new team member, a complex release, or a holiday can shift a sprint’s result. A steady pattern across several sprints is more informative than a single high bar.
Use the chart to ask questions rather than judge people. If completed work falls for three consecutive sprints, discuss capacity, estimation practices, and blockers together.
How to Calculate a Practical Sprint Forecast
Start with completed work from representative sprints and calculate the average. Then examine the spread in results to understand how much uncertainty your team has recently experienced.
Suppose the last four comparable sprints show 24, 28, 30, and 34 completed points. Add the results and divide by four: the average is 29 points. The observed range is 24 to 34 points.
Use the average as a planning reference
The average can help you discuss an initial sprint scope. It is most useful when the upcoming sprint resembles the historical period in team capacity, work type, and operating conditions.
If two people will be away next sprint, don’t treat 29 points as a fixed target. Adjust the plan through a team discussion and account for the reduced availability.
Use the range to communicate uncertainty
A range gives stakeholders a more honest picture than a single number. In the example, the team’s recent results varied by 10 points, so promising exactly 29 points would hide real uncertainty.
Explain what could move the outcome toward the lower or higher end. A planned platform upgrade might reduce feature work, while a stable sprint with fewer interruptions could support more delivery.
Keep estimation consistent
Velocity is a team-level planning measure. Story points represent relative effort within a team, so they are not a reliable basis for comparing one team’s output with another’s.
If your team changes its estimation approach, mark the point in its history. Older sprints may no longer be comparable, just as measurements taken with different scales cannot be lined up cleanly.
Improve the Quality of Your Sprint History
Forecasts depend on the consistency of sprint records. If teams frequently change estimates, move work between sprints without discussion, or leave completed work in active statuses, chart patterns can become difficult to interpret.
Imagine a story estimated at eight points that is reduced to three points just before sprint end. If that change happens repeatedly, the team’s history may suggest more predictable delivery than its original commitments support.
Agree on what counts as complete
Make sure the team understands which workflow statuses represent completed work. If stories are marked complete only after review or testing, the team should use that rule consistently across sprints.
For instance, a team that counts a story as complete after coding may report different results from a team that waits for testing and acceptance. Neither approach is automatically right, but consistency matters.
Record scope changes openly
Work added after sprint planning can explain why a team’s completed total differs from its original commitment. Note significant changes in sprint reviews or planning conversations so the chart has useful context.
When a critical support issue takes four points of effort, discuss its effect on planned work. That gives the team a clearer picture than quietly adding the issue and judging the final bar alone.
Separate team learning from performance pressure
Velocity can become harmful when people feel pushed to increase estimates or deliver a bigger number each sprint. That pressure weakens the measure and can encourage work to be split or estimated inconsistently.
Use the chart to improve planning, spot recurring blockers, and set expectations. Don’t use it as an individual performance score or a contest between teams.
Common Forecasting Mistakes to Avoid
Even a correctly configured chart can be misused. These common mistakes can turn a helpful planning signal into a misleading commitment.
- Planning from one unusually high sprint: A single result may reflect a one-off mix of small tasks or unusual capacity. Review several comparable sprints before setting a forecast.
- Comparing velocity across teams: Estimation scales and working practices differ. Keep the chart focused on the team whose history it represents.
- Treating the average as a promise: An average describes prior results, not a guaranteed outcome. Share a range and explain material changes in capacity or work.
- Ignoring work added mid-sprint: Unplanned work can reduce progress on the original scope. Record and discuss significant interruptions when reviewing results.
- Changing estimates to improve the chart: Re-estimating completed work can distort comparisons. Keep estimation rules clear and discuss changes transparently.
Project and Knowledge Management with ONES.com
Value proposition: ONES.com brings project management and knowledge management together in a unified platform, with ONES Project for project management and ONES Wiki for knowledge management. The products are sold separately, so teams can choose the capabilities that fit their setup.

For teams looking beyond Jira, ONES Project is a Jira alternative with sprint management, Jira-compatible workflows, built-in reporting, and options for custom workflows and fields. It can help teams keep planning and reporting connected while reducing reliance on plugins.
Core capabilities
- Scattered sprint planning: ONES Project provides sprint management → teams can organize sprint work in their project management environment.
- Workflow differences: Jira-compatible workflows support familiar patterns → teams can adapt workflows while preserving practices that already work for them.
- Limited reporting flexibility: Built-in reporting helps surface project information → teams can review progress without relying on a separate reporting plugin for every need.
- Rigid process fields: Custom workflows and fields allow teams to reflect their process → teams can track the details that matter to their projects.
- Repetitive project tasks: Automation can handle supported routine actions → teams can reduce manual steps in project workflows.
- Plugin sprawl: Native capabilities can reduce the number of add-ons needed for common project work → teams can manage fewer separate extensions.
- Deployment constraints: ONES.com offers Cloud, On-Premise, Private Cloud, and Air-gapped deployments → organizations can choose an environment suited to their operational needs.
- Different feature needs across environments: Cloud and self-hosted versions have full feature parity → teams can select a deployment without giving up feature access.
- Early-stage team needs: The free plan supports up to 30 seats → smaller teams can explore the platform with room for a group to work together.
Application scenarios
A Scrum team moving from Jira can use ONES Project to manage sprint work, workflows, fields, and reporting in one project management environment. Jira-compatible workflows can help preserve familiar routines while the team evaluates whether it can reduce its plugin footprint.
An organization with restricted network requirements can consider an On-Premise, Private Cloud, or Air-gapped deployment. A team that also needs shared knowledge management can use ONES Wiki separately from ONES Project, with ONES.com offering both products in its broader platform.
ONES.com is powered by ONES Assistant. Teams evaluating project management capabilities can focus on whether ONES Project’s workflow, reporting, deployment, and sprint management options fit their needs.
Common Challenges
There isn’t enough sprint history
Problem: A new team or newly created board may have only one or two completed sprints, making the forecast uncertain.
Solution: Use the available results as an early reference, then plan conservatively. Revisit the forecast after each sprint and build a more representative history over time.
Completed work appears lower than expected
Problem: The chart may show a low completed total even when the team felt busy throughout the sprint.
Solution: Review incomplete stories, unplanned work, workflow status rules, and dependencies. A busy team can still finish less planned work when interruptions consume capacity.
Team estimates have changed
Problem: Historical results may no longer be comparable after a change in estimation practice or team composition.
Solution: Identify when the practice changed and use recent, comparable sprints for the next forecast. Avoid treating older results as equivalent when the team’s measurement approach differs.
Stakeholders expect a guaranteed number
Problem: A single average can look like a fixed delivery commitment when presented without context.
Solution: Share the average alongside a recent range, explain known capacity changes, and clarify that the chart reflects past delivery. Update the forecast when important conditions change.
FAQs
What does a Jira velocity chart measure?
A Jira velocity chart shows how much work a Scrum team committed to and completed across sprints, using the board’s selected estimation method. Depending on the Jira version and configuration, the report displays commitment and completion in separate bars. It helps a team review its recent delivery pattern, but it does not measure individual performance or guarantee future output.
How many sprints should I use for a forecast?
Three to five recent, representative sprints can provide a useful starting point. A team with highly variable work may want a longer history, while a newly formed team may need to begin with fewer results and revisit its estimate frequently. Choose sprints that reflect current team practices, capacity, and work. Explain any unusual sprint you leave out.
Should velocity increase every sprint?
No. Velocity naturally varies with capacity, work complexity, interruptions, and team circumstances. Treating an increase as a required target can encourage inconsistent estimates and weaken the chart’s usefulness. Review whether the team’s planning is becoming more reliable and whether blockers are being addressed. A stable forecast can be valuable even when the velocity number does not rise.
Can I compare velocity between Jira teams?
Comparing point totals between teams is usually misleading. Teams can use different estimation scales, workflows, and definitions of completed work, so the same number may not represent the same effort. Use velocity within the team that created the estimates. For cross-team planning, discuss dependencies, scope, and delivery expectations without treating point totals as a shared measurement.
Why does completed work differ from the original sprint commitment?
Teams may finish less than they committed because of interruptions, dependencies, underestimated work, absences, or stories that remain unfinished. The scope may also change during the sprint. Review the difference with the team and identify the reason before adjusting the next forecast. The chart signals a result; the team’s sprint review provides the context needed to understand it.
Conclusion
A Jira velocity chart can make sprint planning more grounded when you read several comparable sprints, check how the board estimates work, and account for changes in capacity and scope. Use the average as a reference and the recent range to communicate uncertainty.
When a forecast misses, investigate the conditions rather than blaming the number or the people. A thoughtful review turns the chart into a way to improve planning, set clearer expectations, and make the next sprint more realistic.